Round 2
Report created 2024-11-25
Scenarios
Scenario description
We asked teams of researchers across Europe to use quantitative models to project COVID-19 outcomes for 32 European countries over the next year. In order to explore different sets of assumptions about drivers of the pandemic, we asked teams to vary four sets of parameters. We can describe this in a 2x2 scenario specification:
Age 60+ booster campaign
|
Age 18+ booster campaign
|
|
Optimistic vaccine effectiveness
|
Scenario A | Scenario B |
Pessimistic vaccine effectiveness
|
Scenario C | Scenario D |
See also the full scenario details for more detail on the common set of assumptions teams used to create their models.
In Round 2, we asked modellers to start their projections from the 2022-07-24. Data after this date were not included, and as a result, model projections are unlikely to fully account for later information on the changing variants or behavioural patterns.
In this report we only show results from countries with at least 3 models.
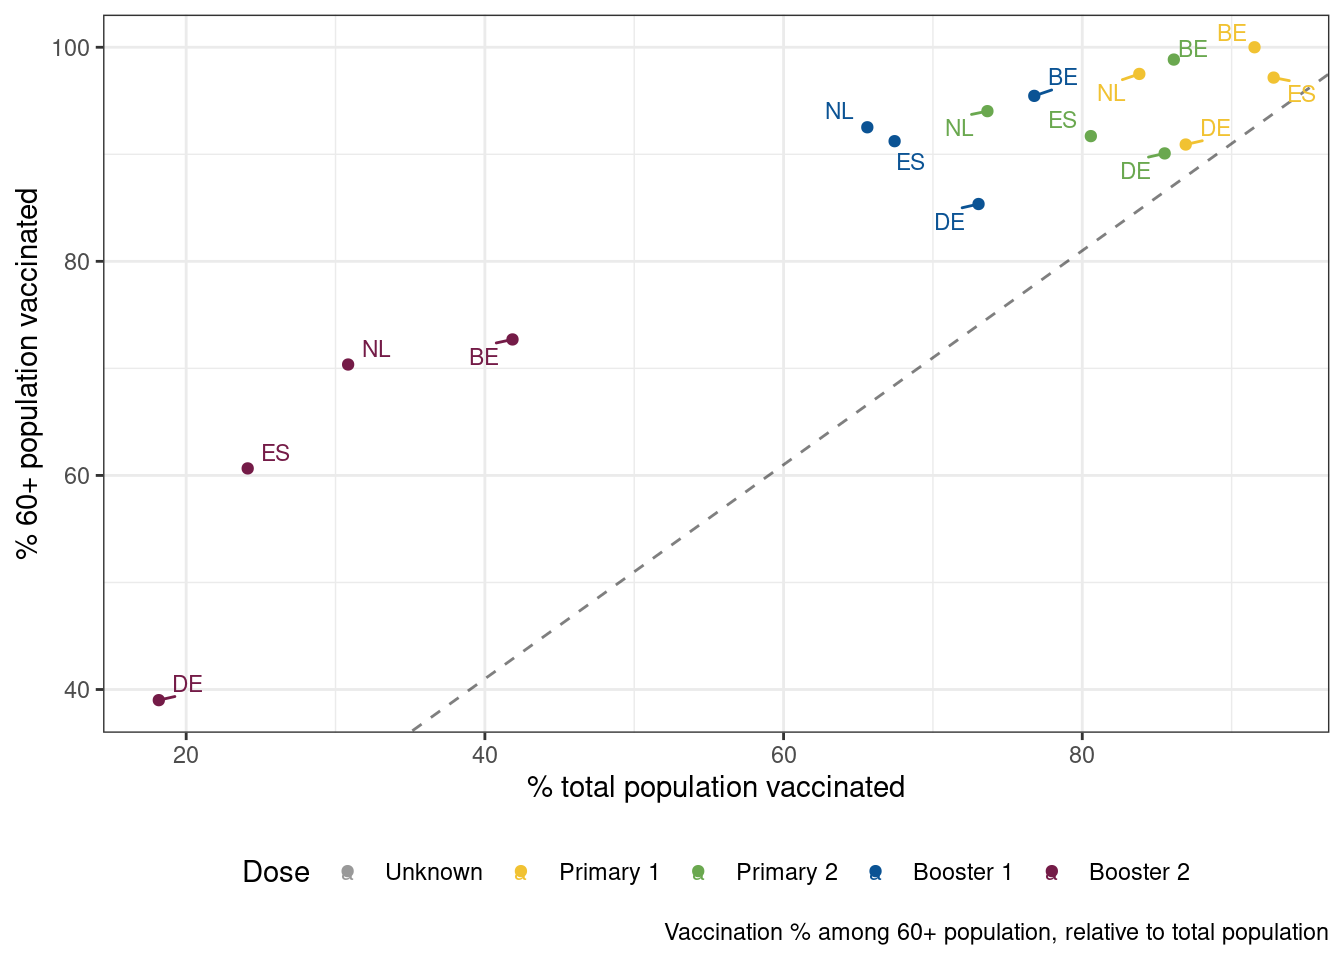
Current situation
We consider vaccination rates in countries for which multiple teams of modellers contributed projections.
Participating teams
6 models contributed scenario projections to Round 2.
Models
| Team | Countries | Weeks |
|---|---|---|
| USC-SIkJalpha | 31 | 52 |
| ECDC-CM_ONE | 28 | 53 |
| MODUS_Covid-Episim | 1 | 53 |
| RIVM-vacamole | 1 | 53 |
| SIMID-SCM | 1 | 52 |
| UC3M-EpiGraph | 1 | 41 |
Countries
| Code | Country | Infection | Case | Hosp | Icu | Death |
|---|---|---|---|---|---|---|
| BE | Belgium | 1 | 3 | 2 | 1 | 3 |
| DE | Germany | 1 | 2 | 2 | 0 | 1 |
| ES | Spain | 1 | 3 | 2 | 0 | 2 |
| NL | Netherlands | 1 | 3 | 2 | 1 | 3 |
Cumulative outcomes
For each model and scenario, we compare the total number of outcomes over the entire projection period as a % of the total country population. We compared the cumulative number of projected outcomes to the cumulative total over one year before projections started (July% 2021 to July% 2022).
Observations
Projections
Death
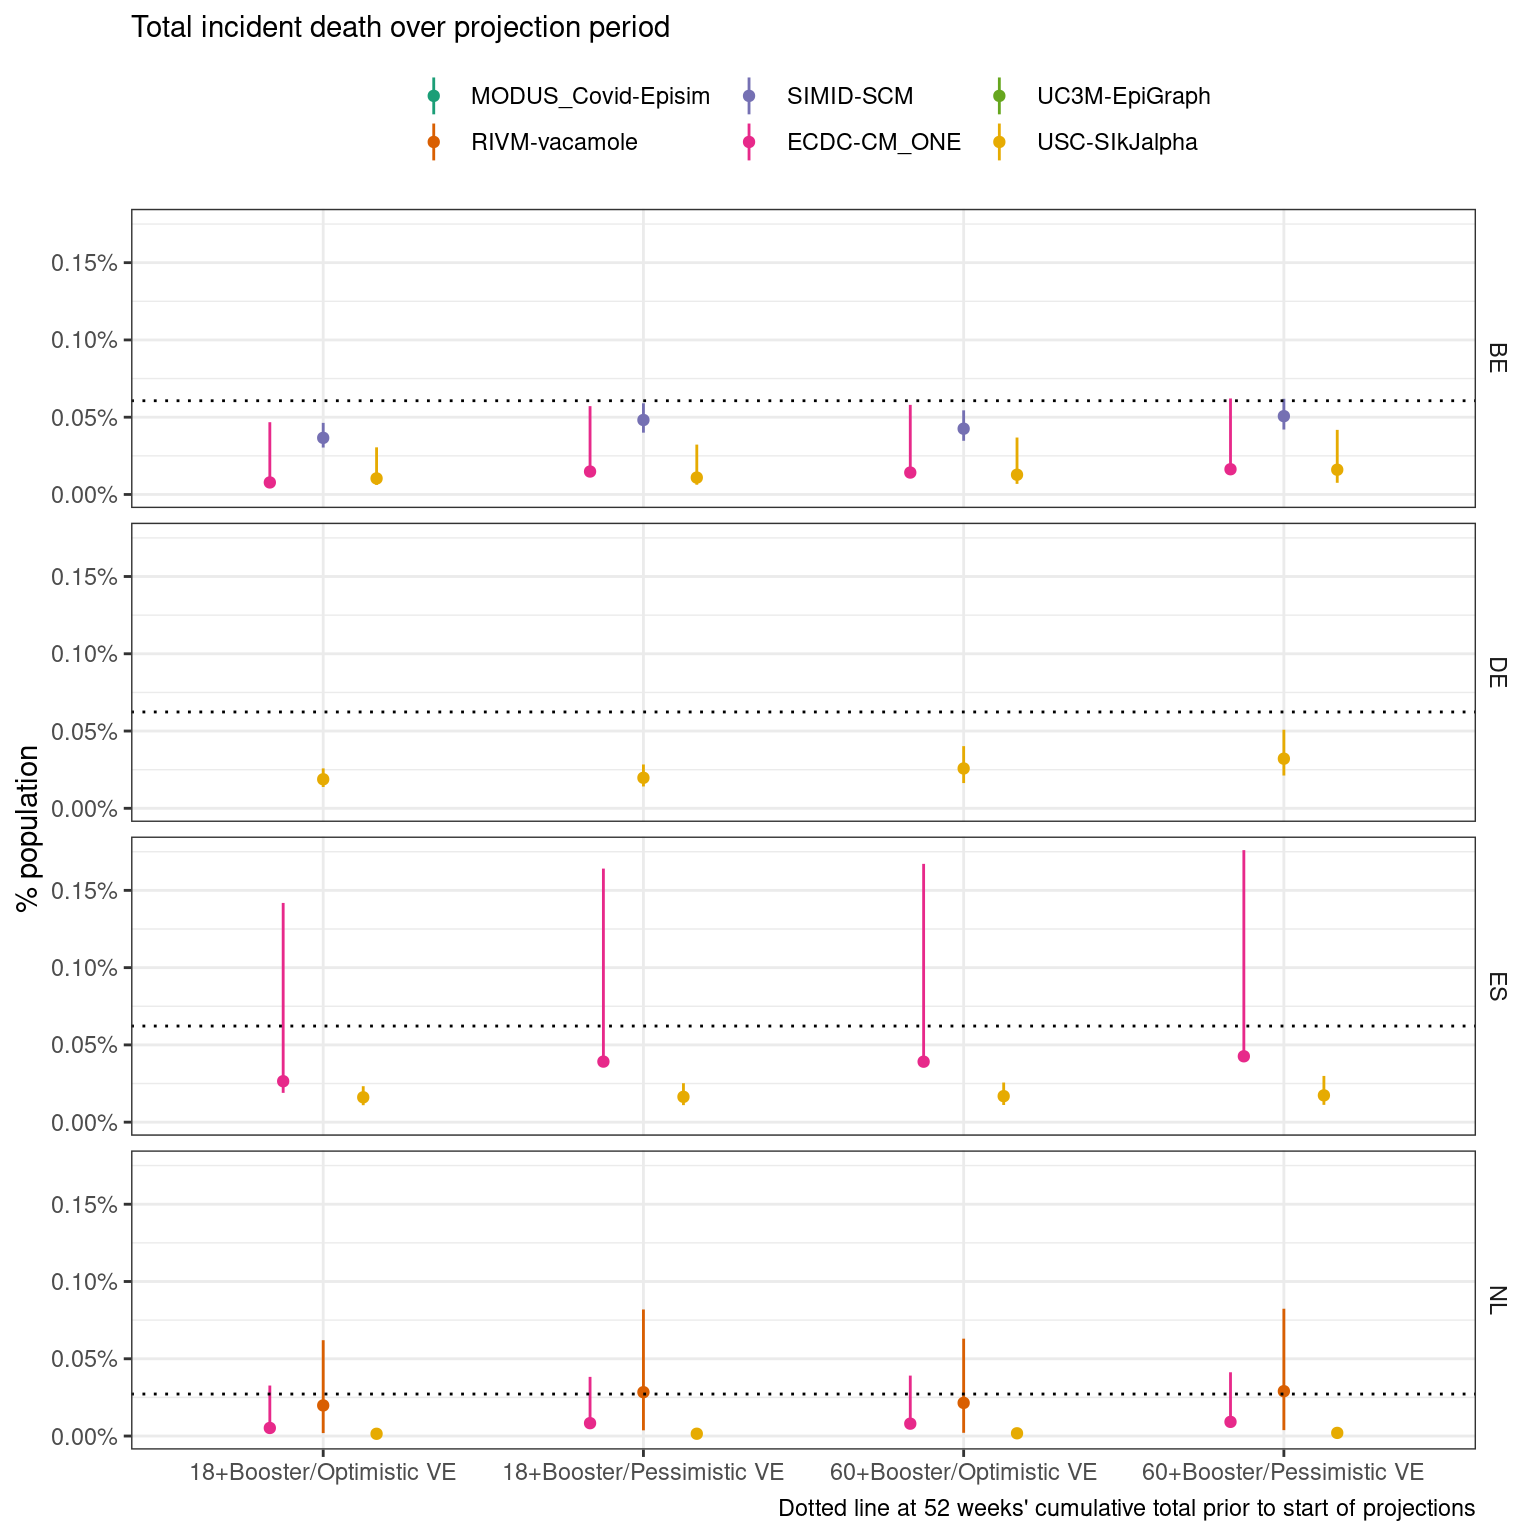
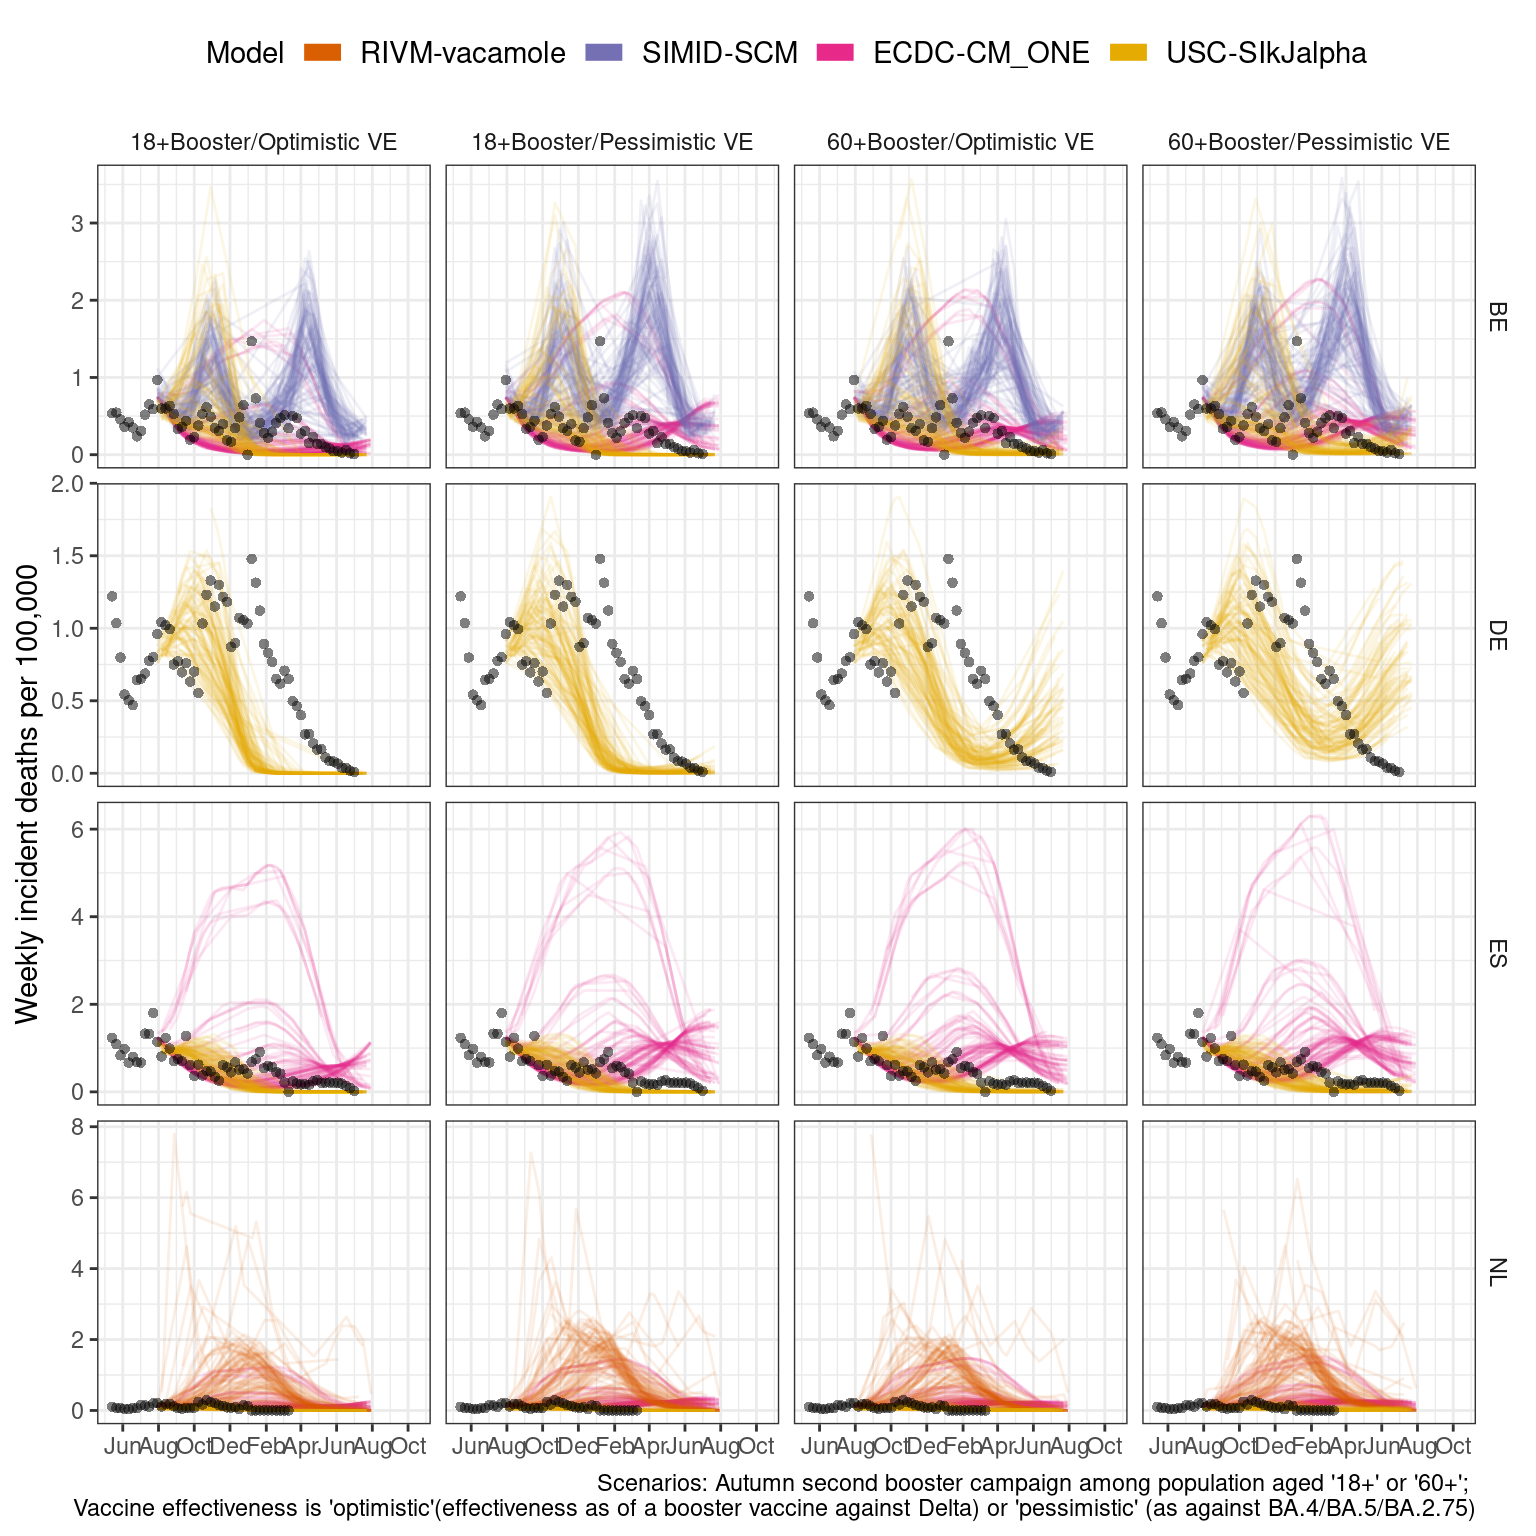
Scenarios: Autumn second booster campaign among population aged ‘18+’ or ‘60+’; Vaccine effectiveness is ‘optimistic’(effectiveness as of a booster vaccine against Delta) or ‘pessimistic’ (as against BA.4/BA.5/BA.2.75)
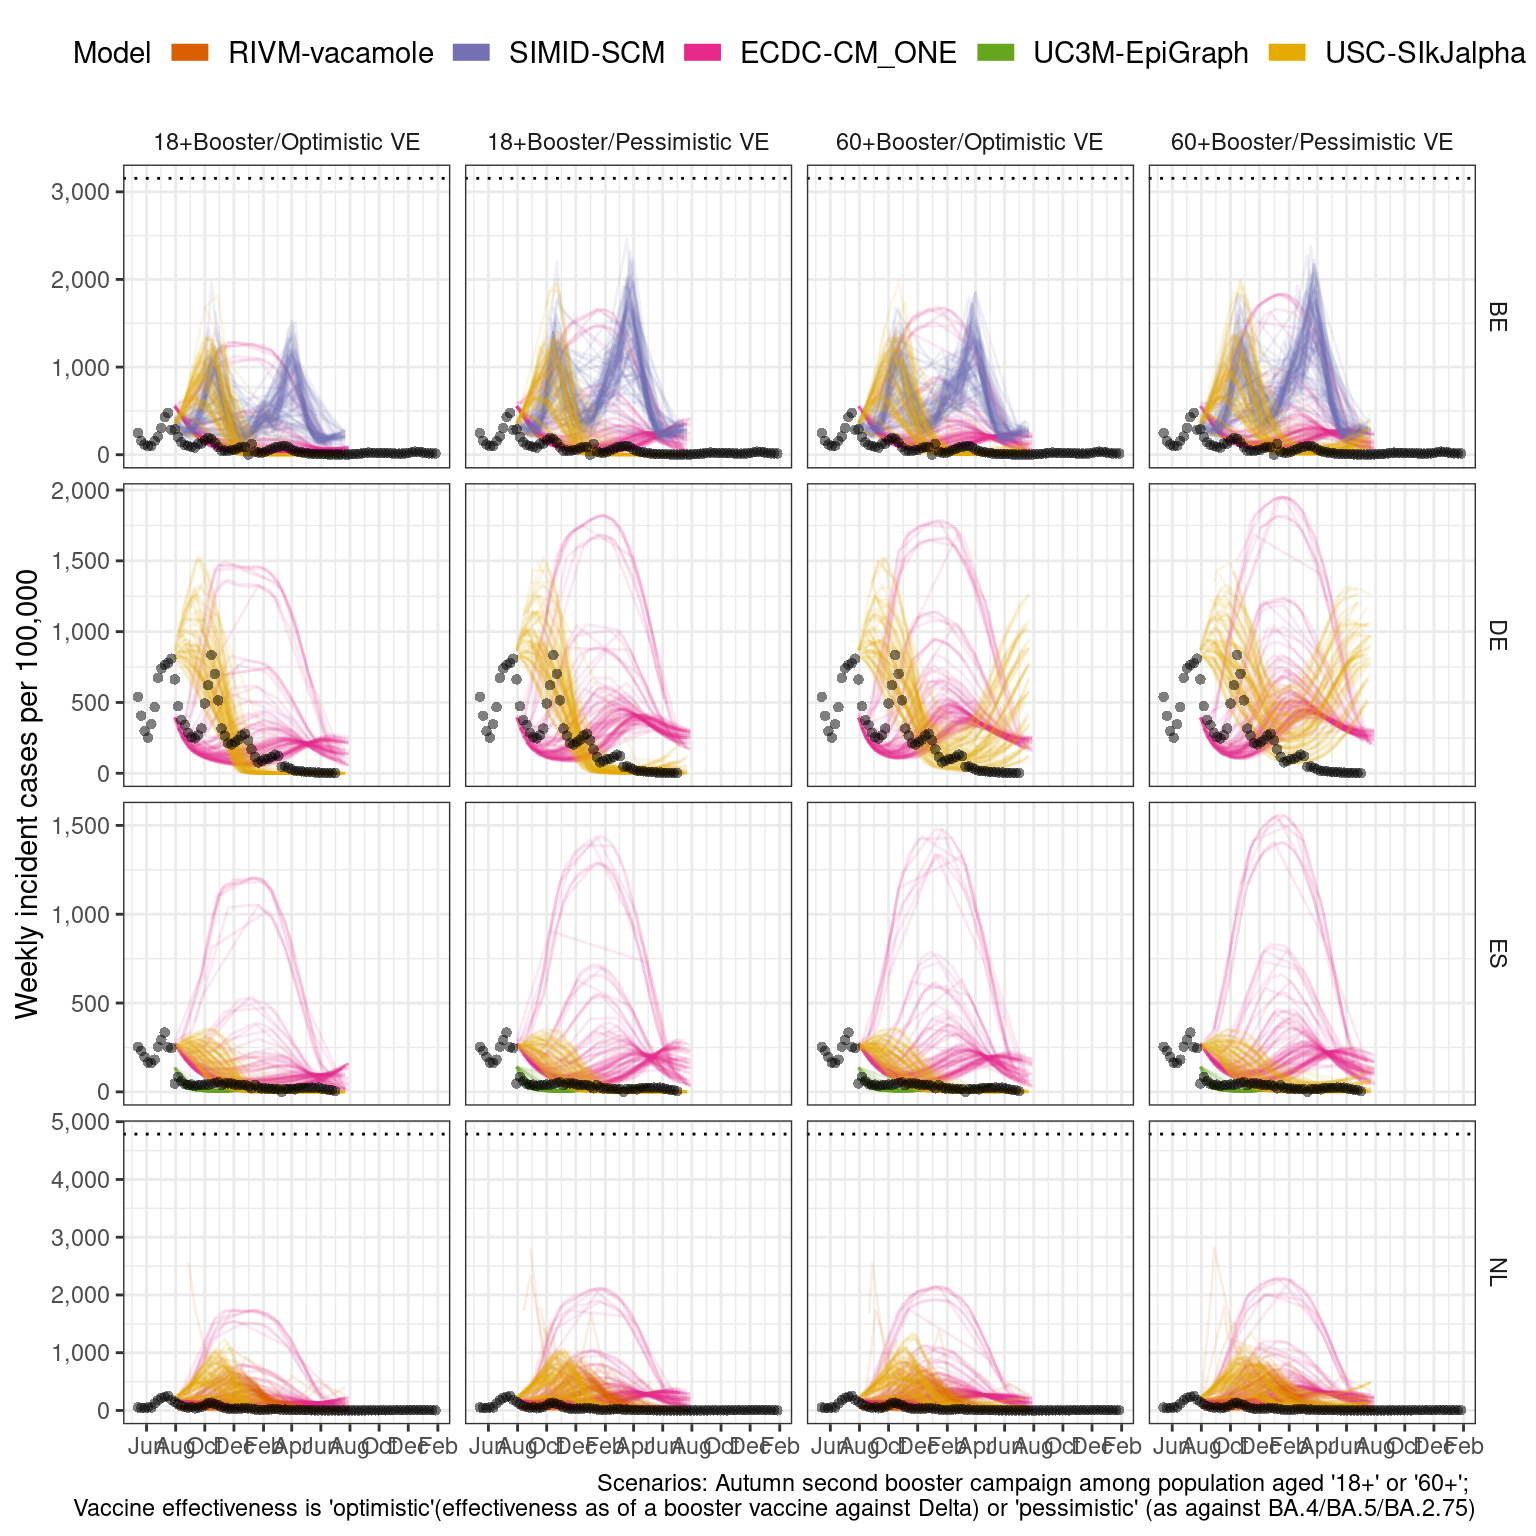
Case
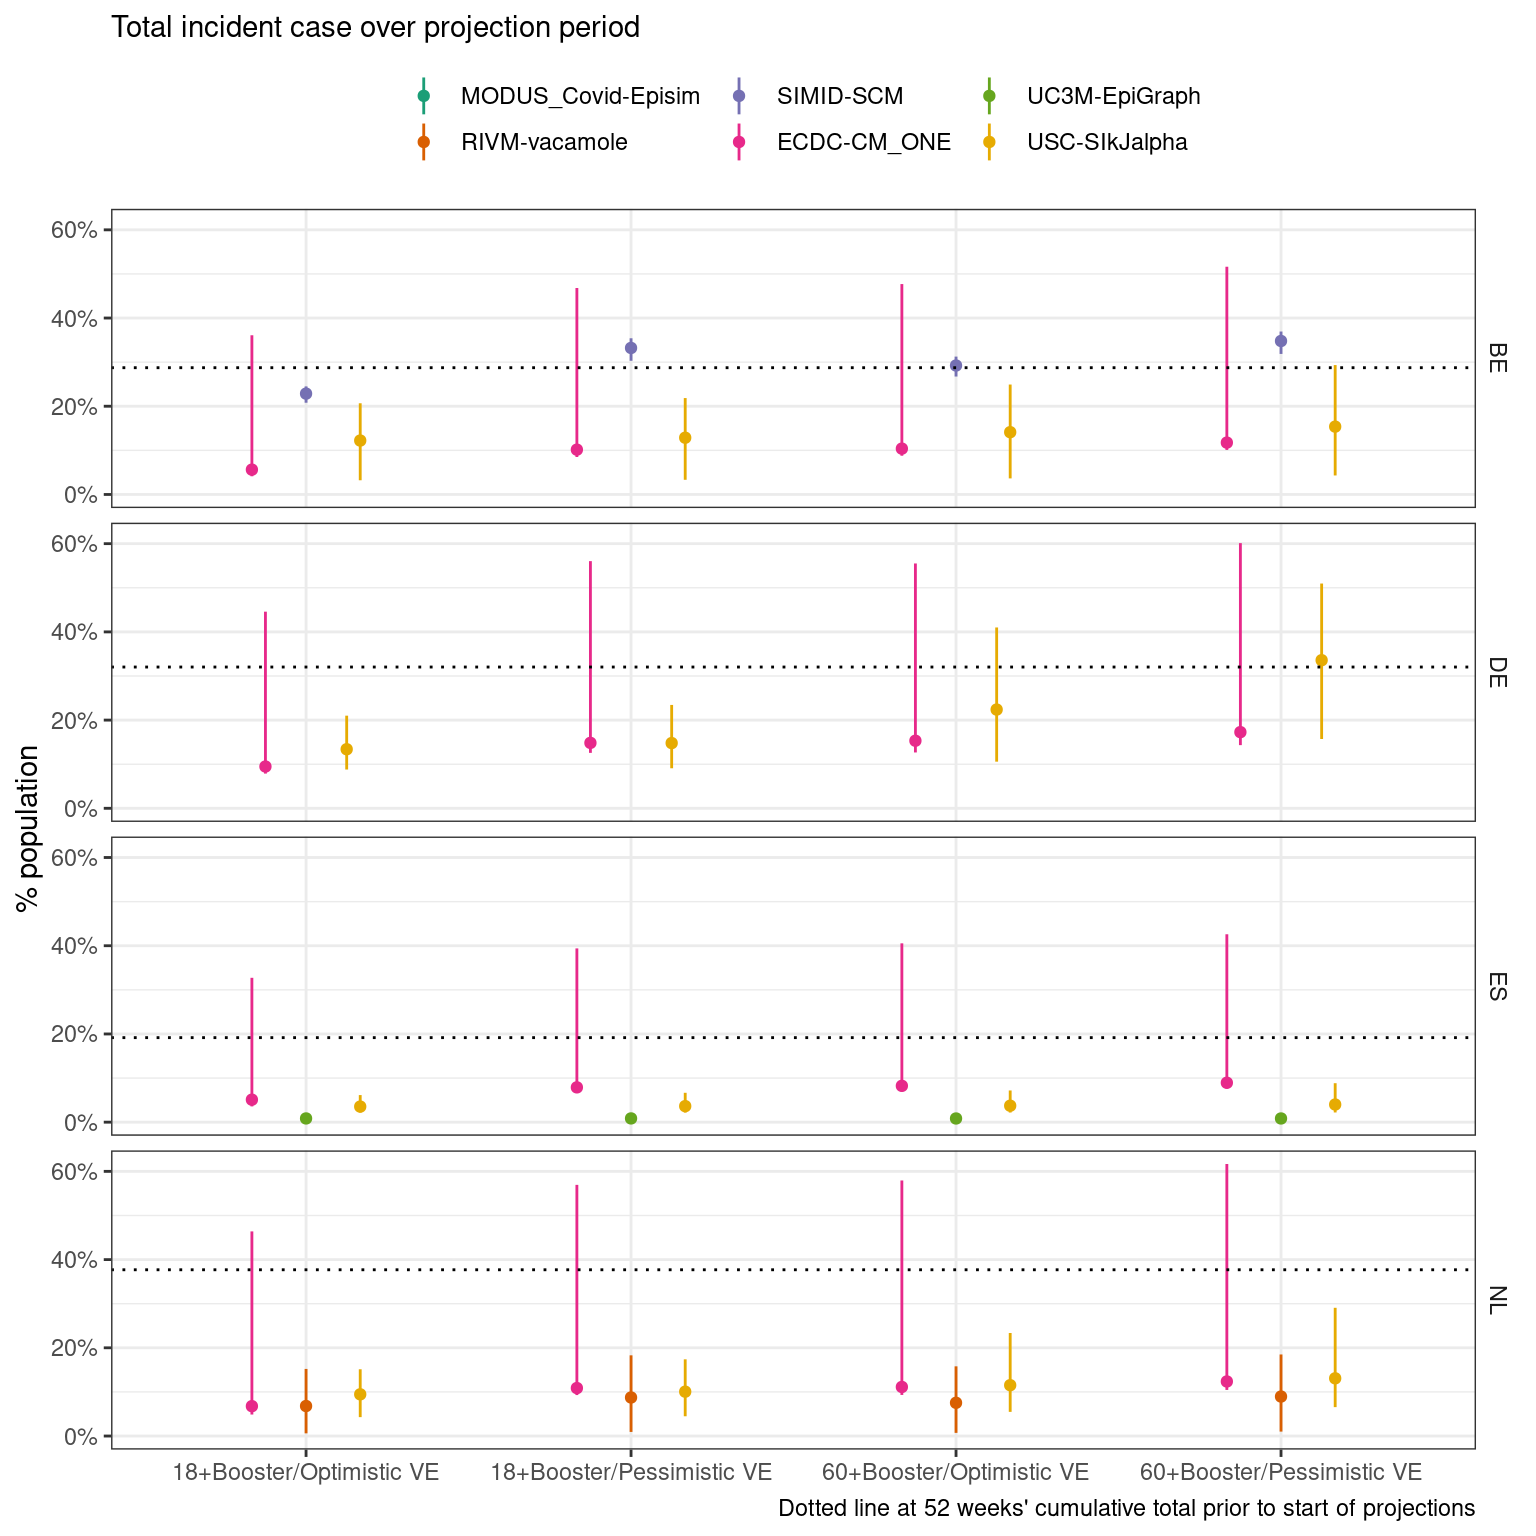
Scenarios: Autumn second booster campaign among population aged ‘18+’ or ‘60+’; Vaccine effectiveness is ‘optimistic’(effectiveness as of a booster vaccine against Delta) or ‘pessimistic’ (as against BA.4/BA.5/BA.2.75)
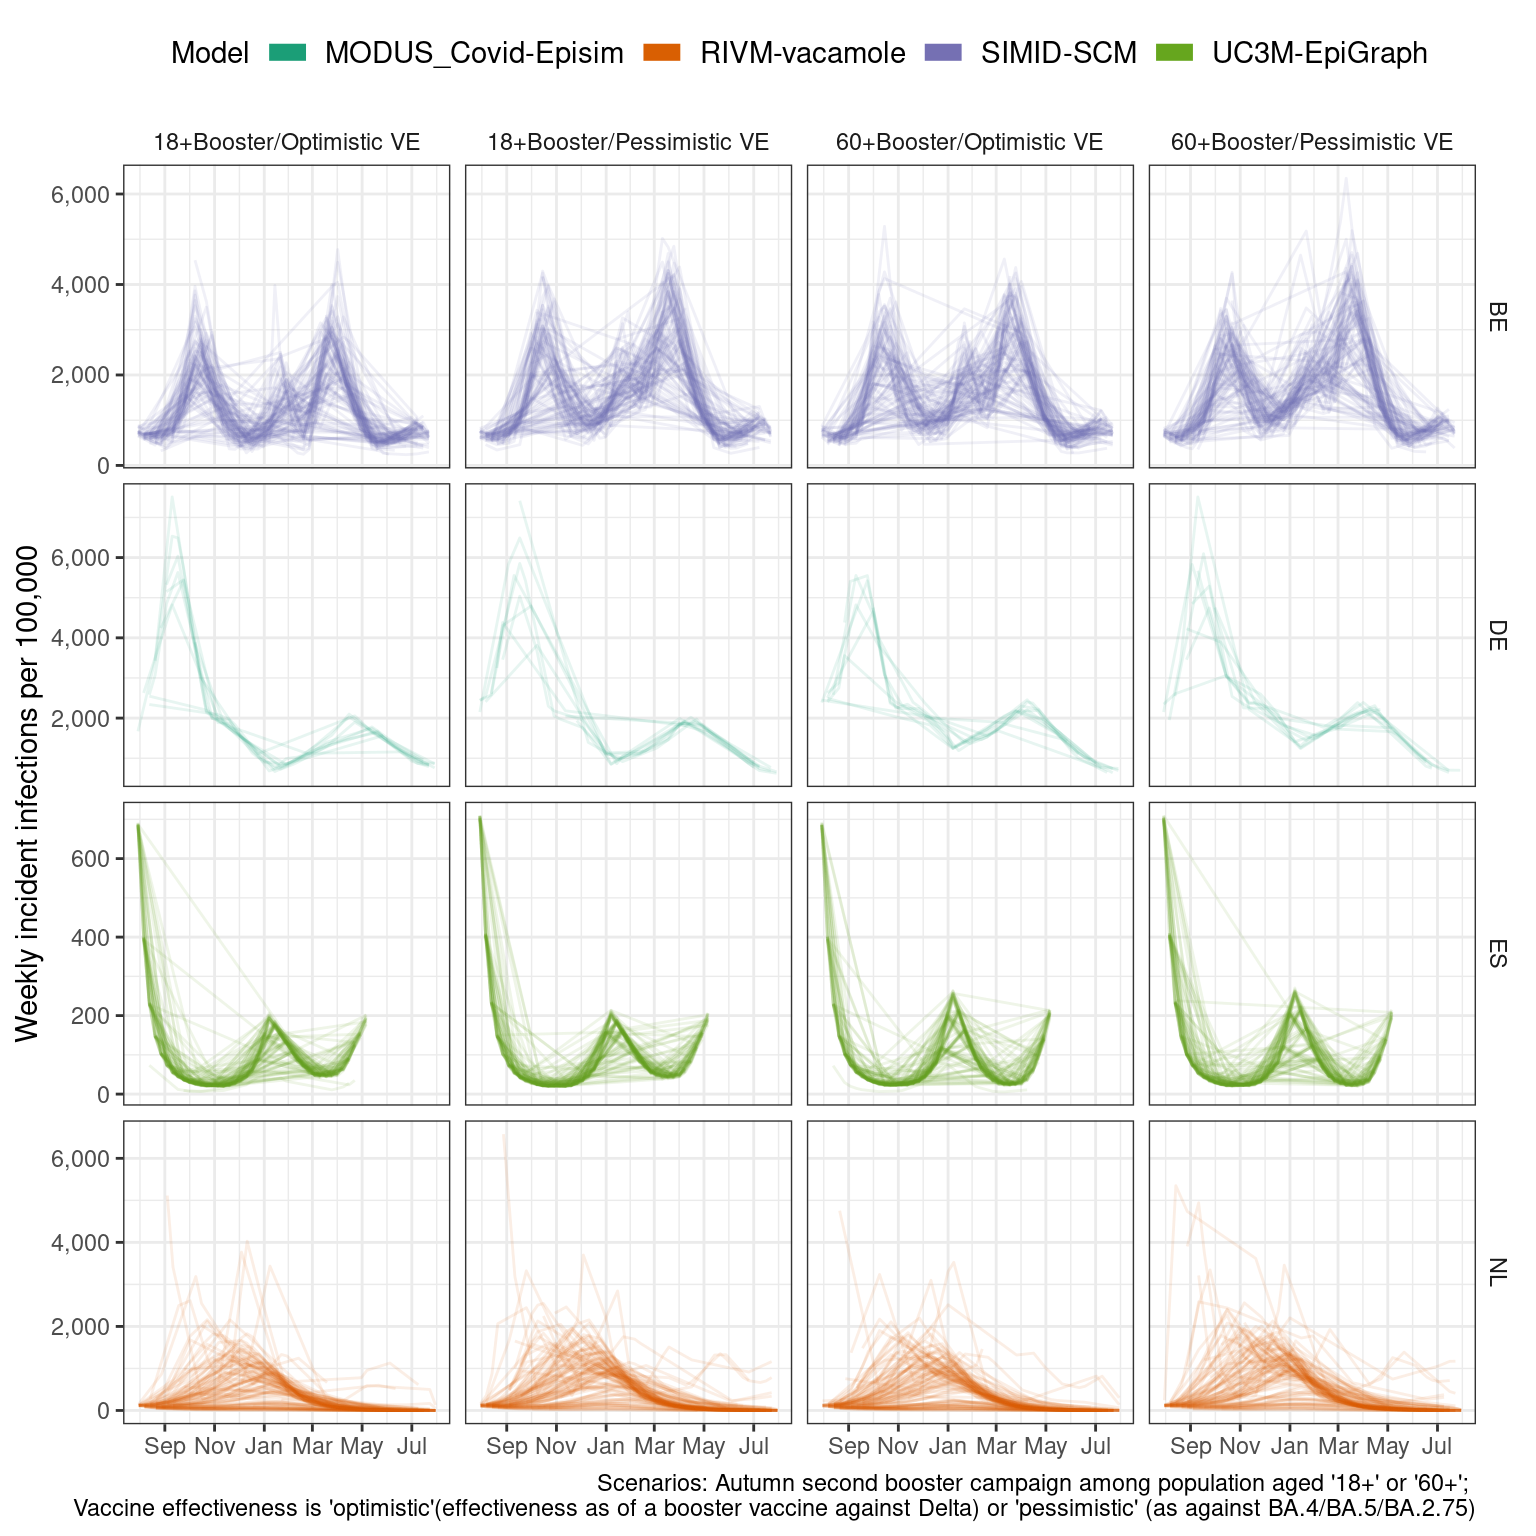
Infection
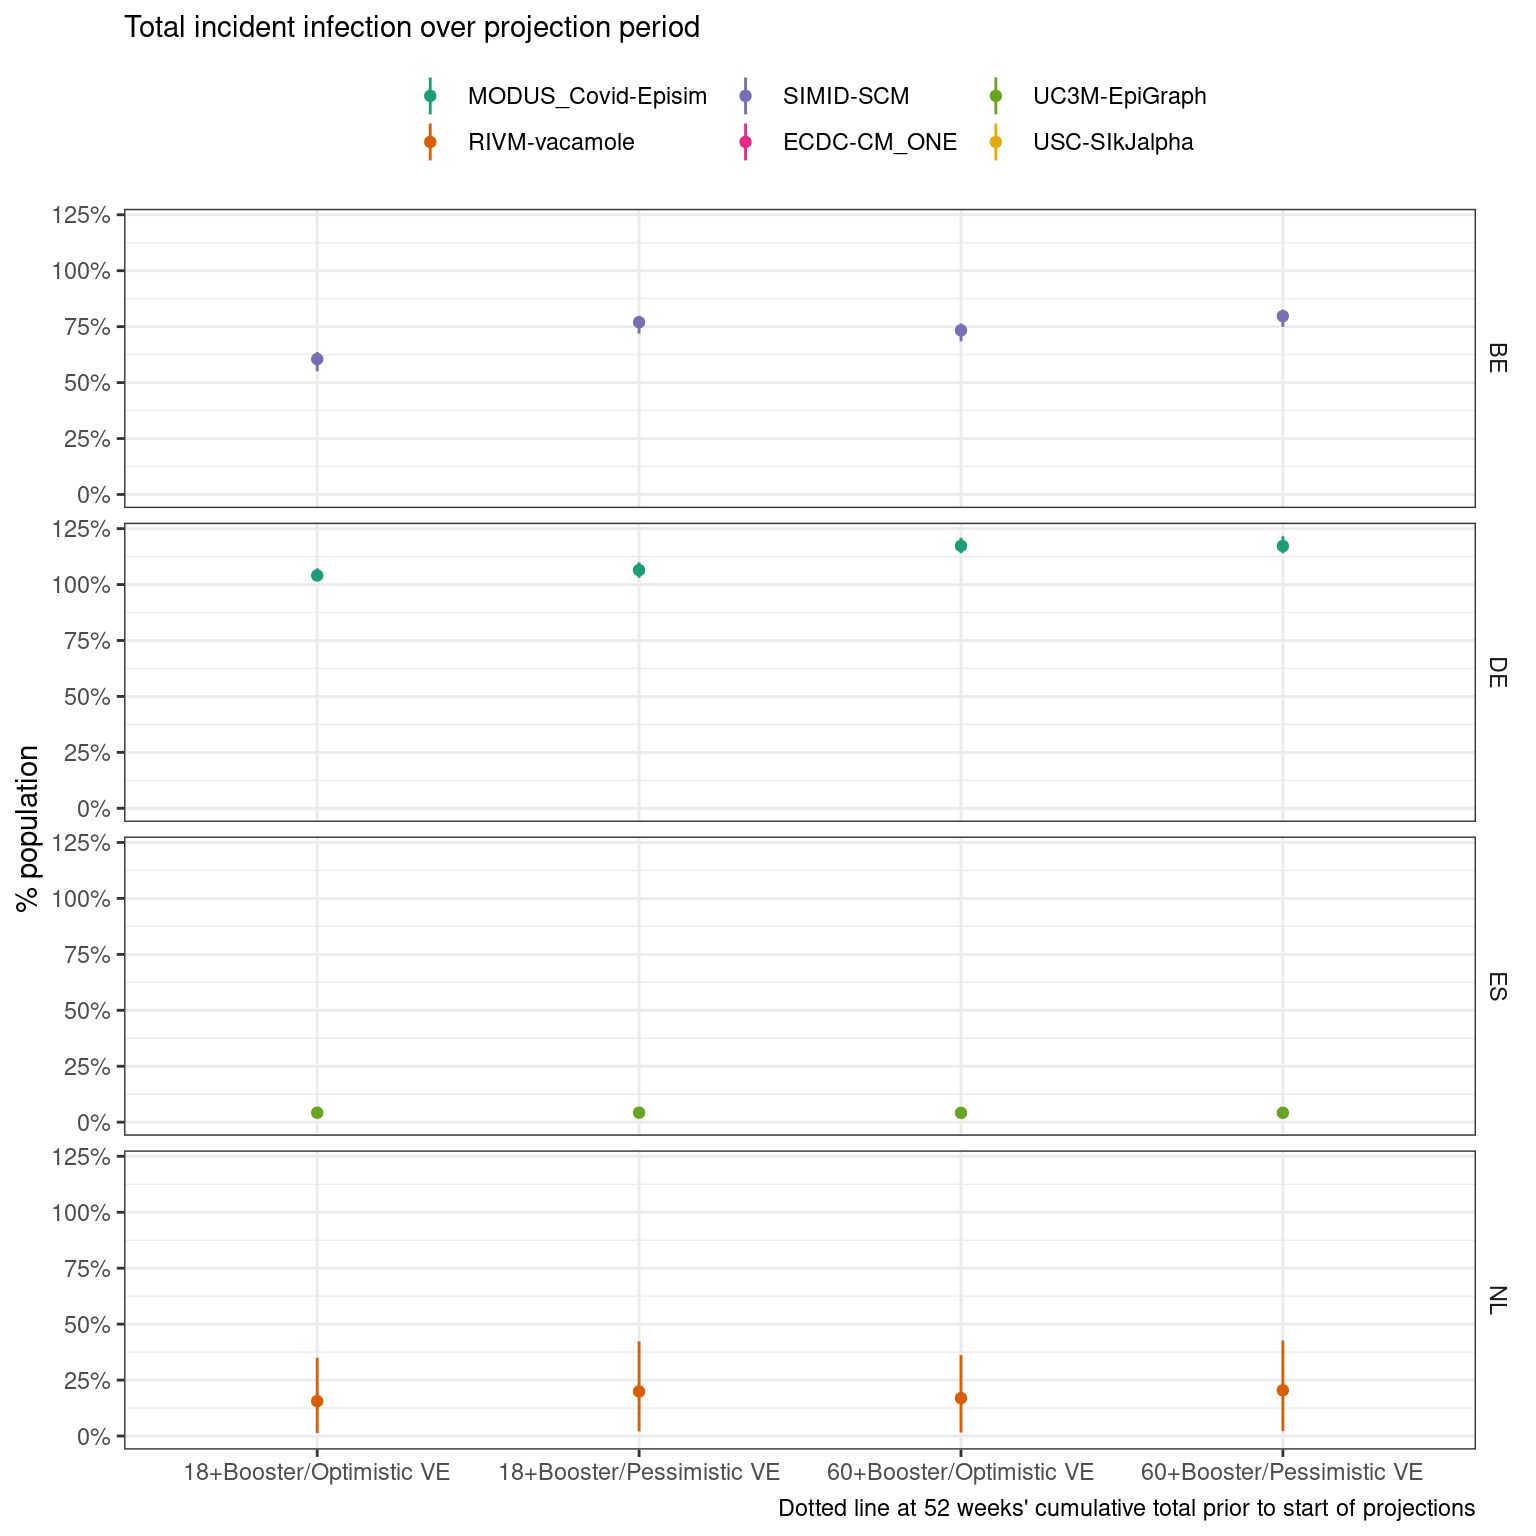
Scenarios: Autumn second booster campaign among population aged ‘18+’ or ‘60+’; Vaccine effectiveness is ‘optimistic’(effectiveness as of a booster vaccine against Delta) or ‘pessimistic’ (as against BA.4/BA.5/BA.2.75)
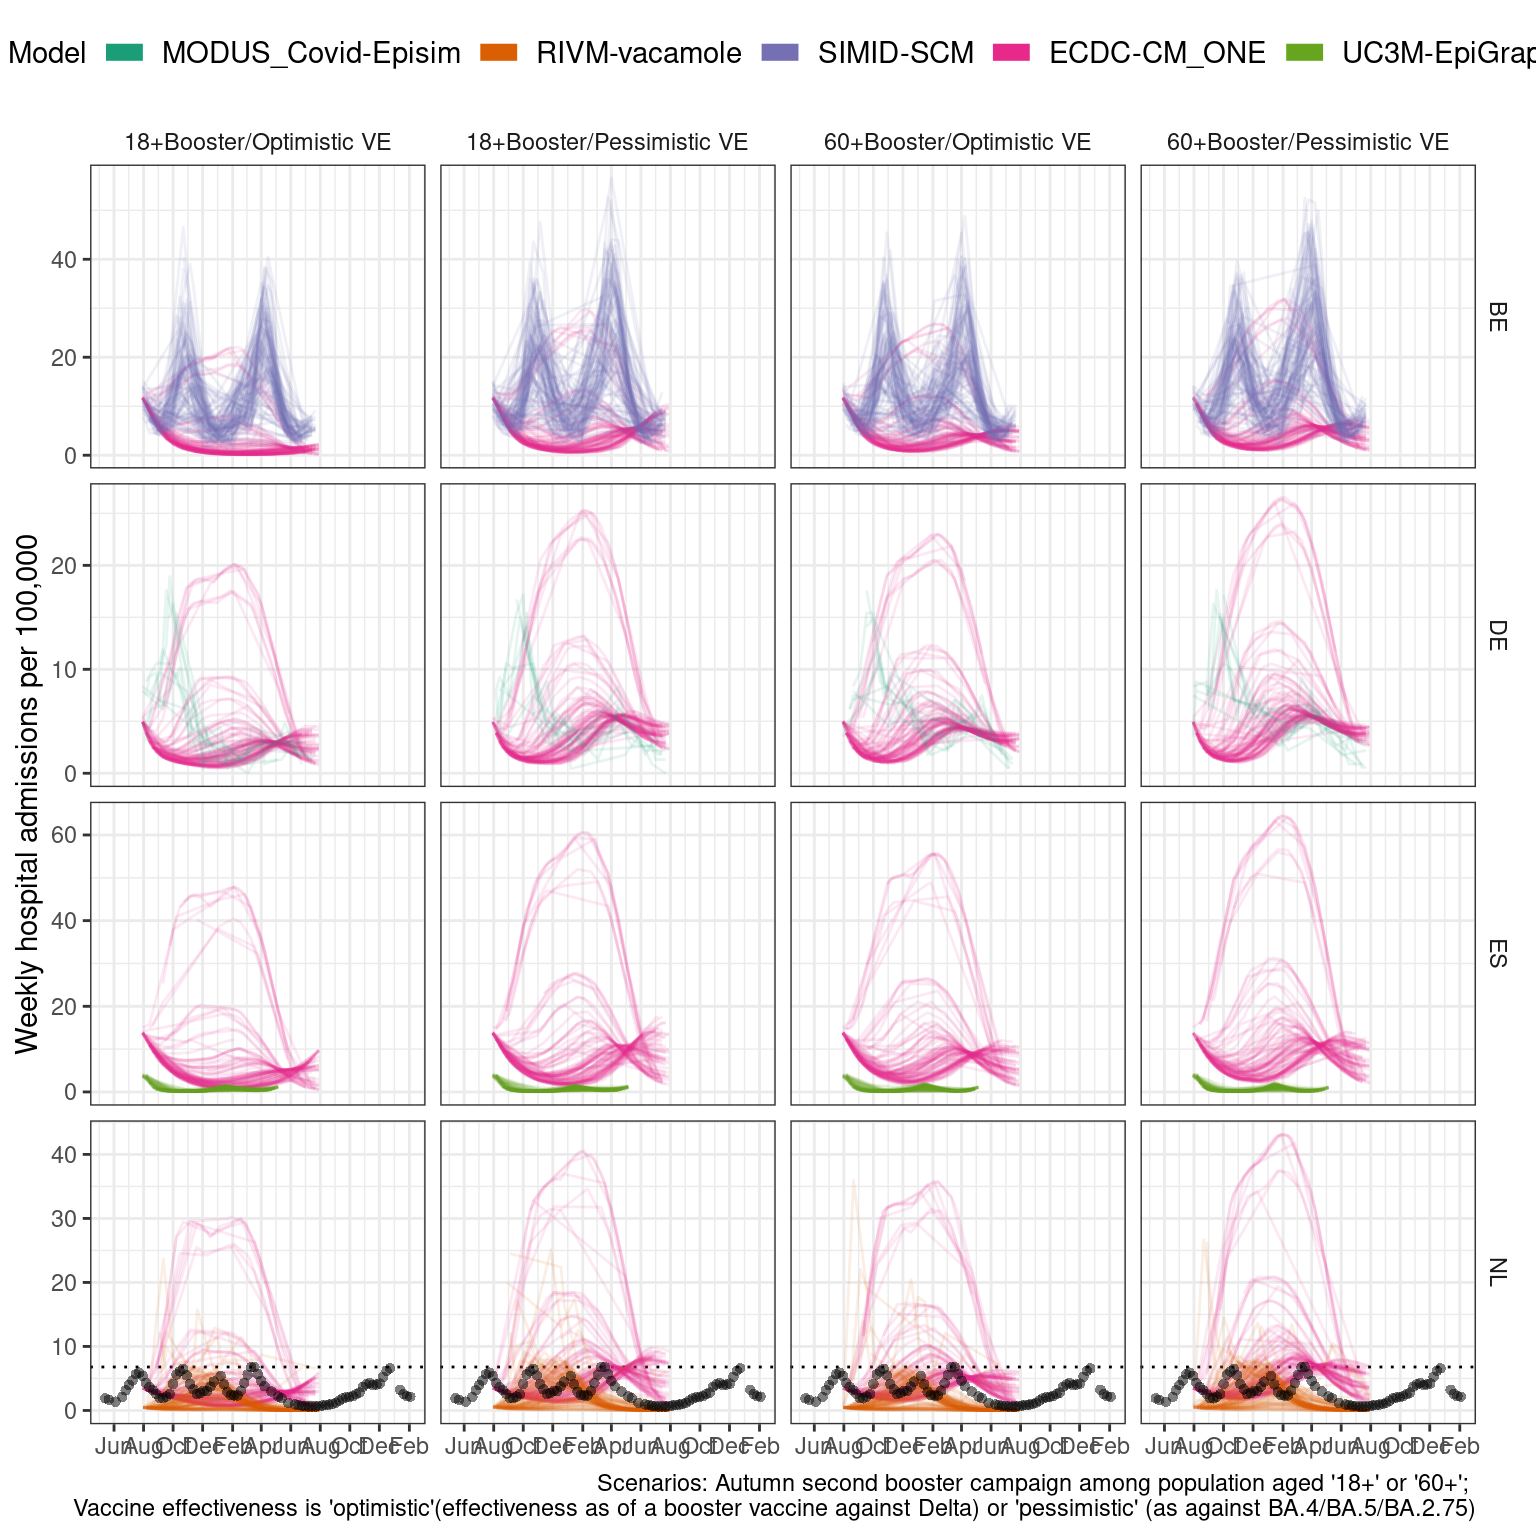
Hosp
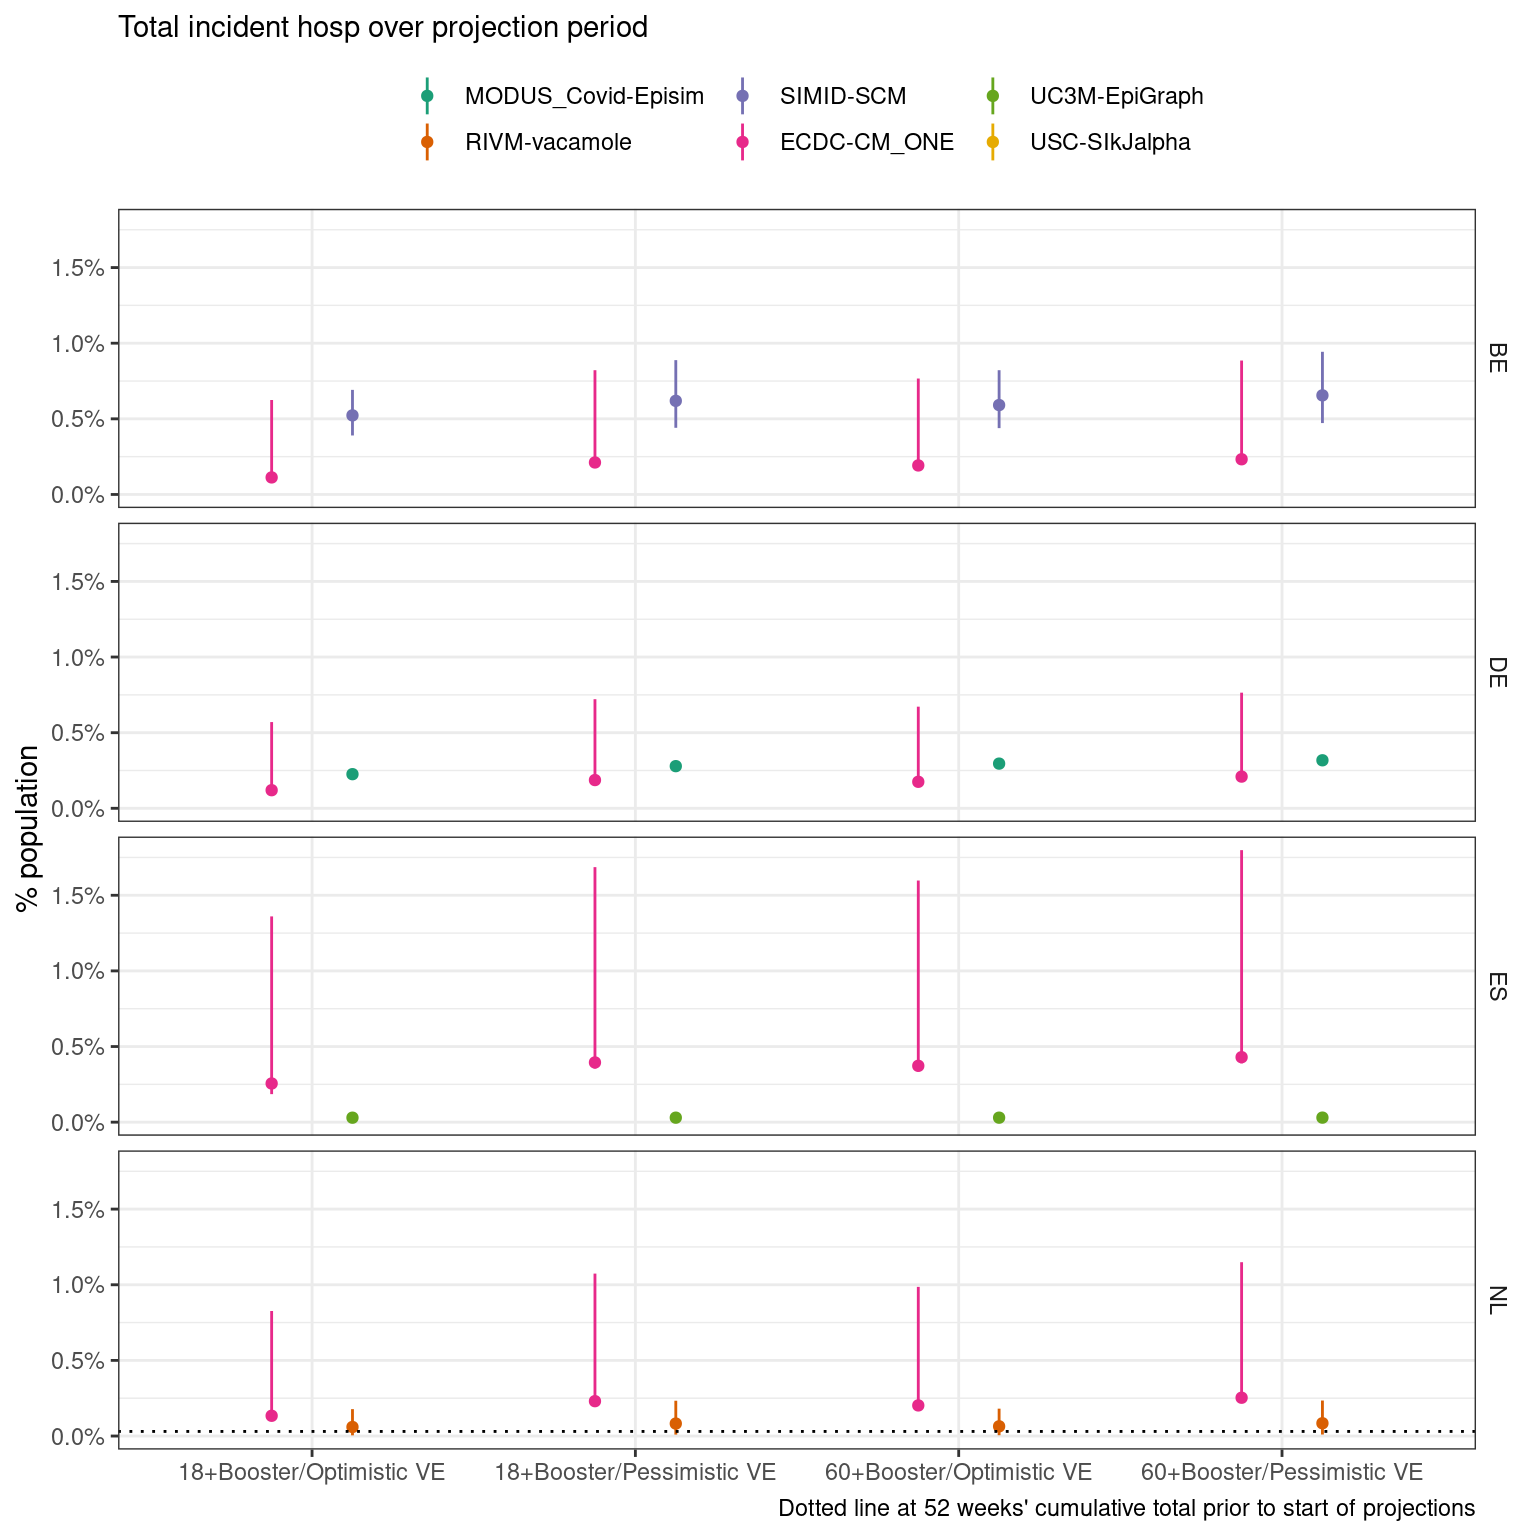
Scenarios: Autumn second booster campaign among population aged ‘18+’ or ‘60+’; Vaccine effectiveness is ‘optimistic’(effectiveness as of a booster vaccine against Delta) or ‘pessimistic’ (as against BA.4/BA.5/BA.2.75)
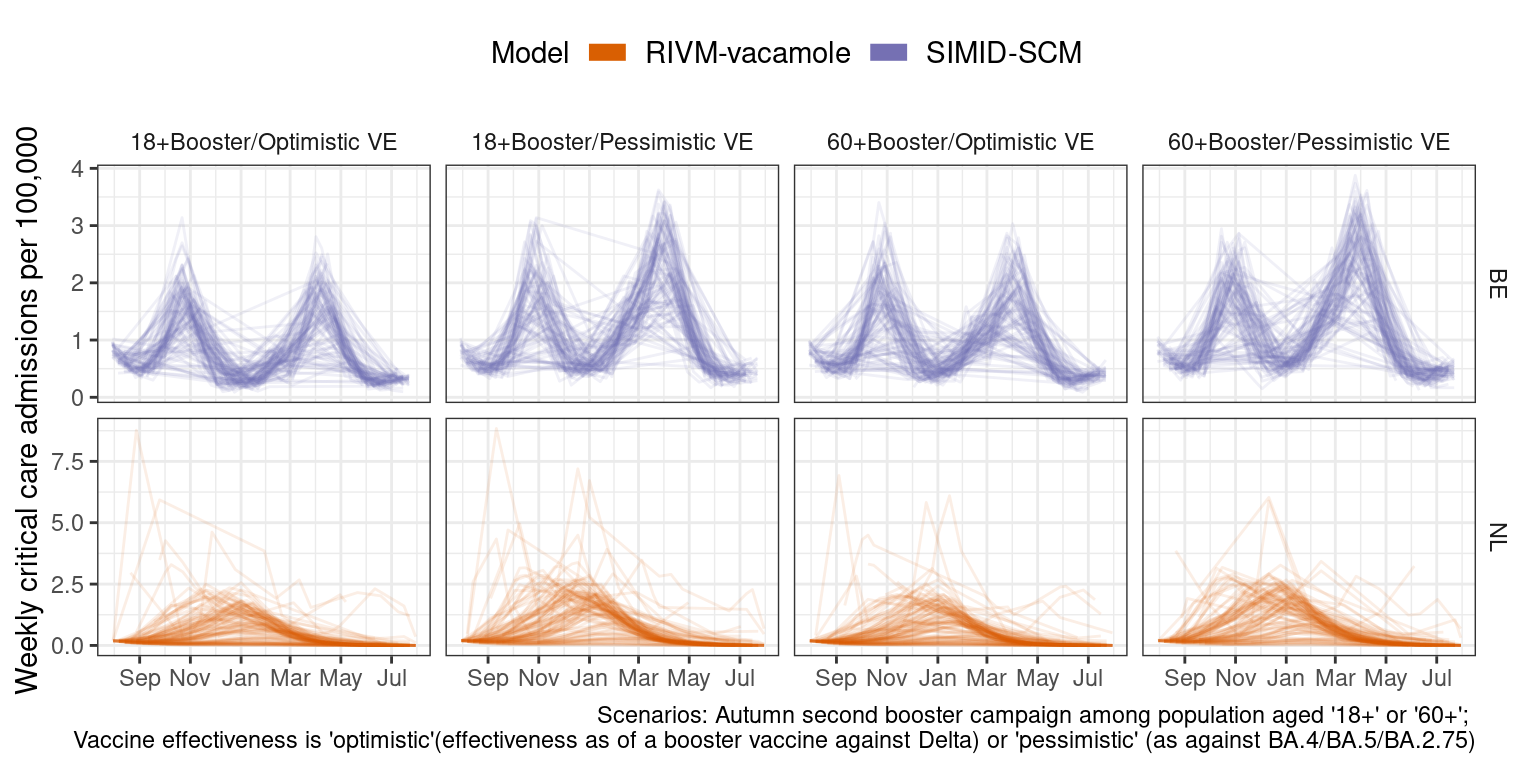
Icu
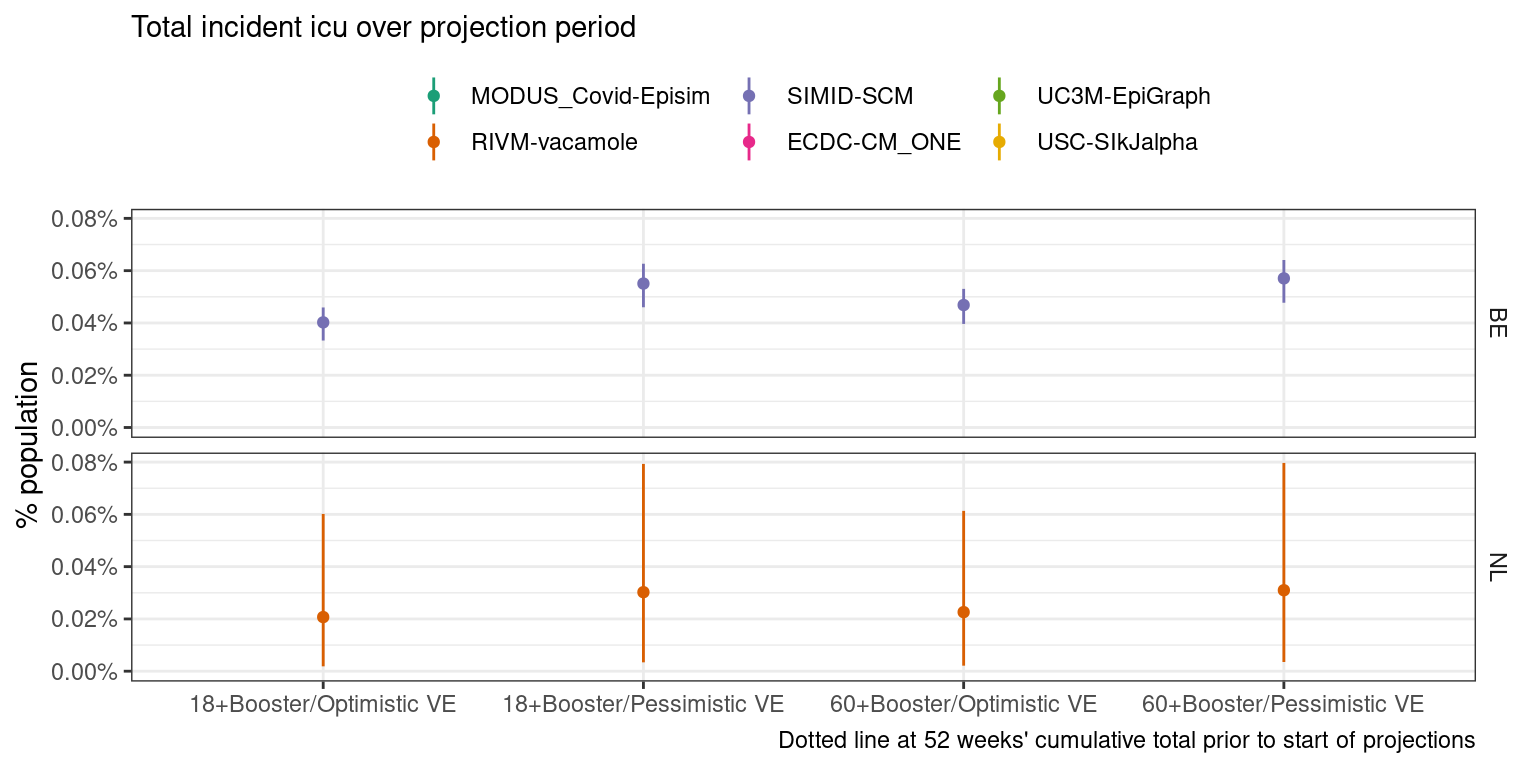
Scenarios: Autumn second booster campaign among population aged ‘18+’ or ‘60+’; Vaccine effectiveness is ‘optimistic’(effectiveness as of a booster vaccine against Delta) or ‘pessimistic’ (as against BA.4/BA.5/BA.2.75)
Incident outcomes
We explored the incidence of COVID-19 per 100,000 over the projection period and in terms of projected peaks in incidence. We summarised peaks both over the entire projection period, and over only the autumn-winter period (October through March); we considered (A) the timing and maximum weekly incidence of each peak, and (B) the total number of peaks.
Observations
Projections
Over time
Death
Case
Infection
Hosp
Icu
Peaks
Autumn-winter
Projections over October 2022 through March 2023
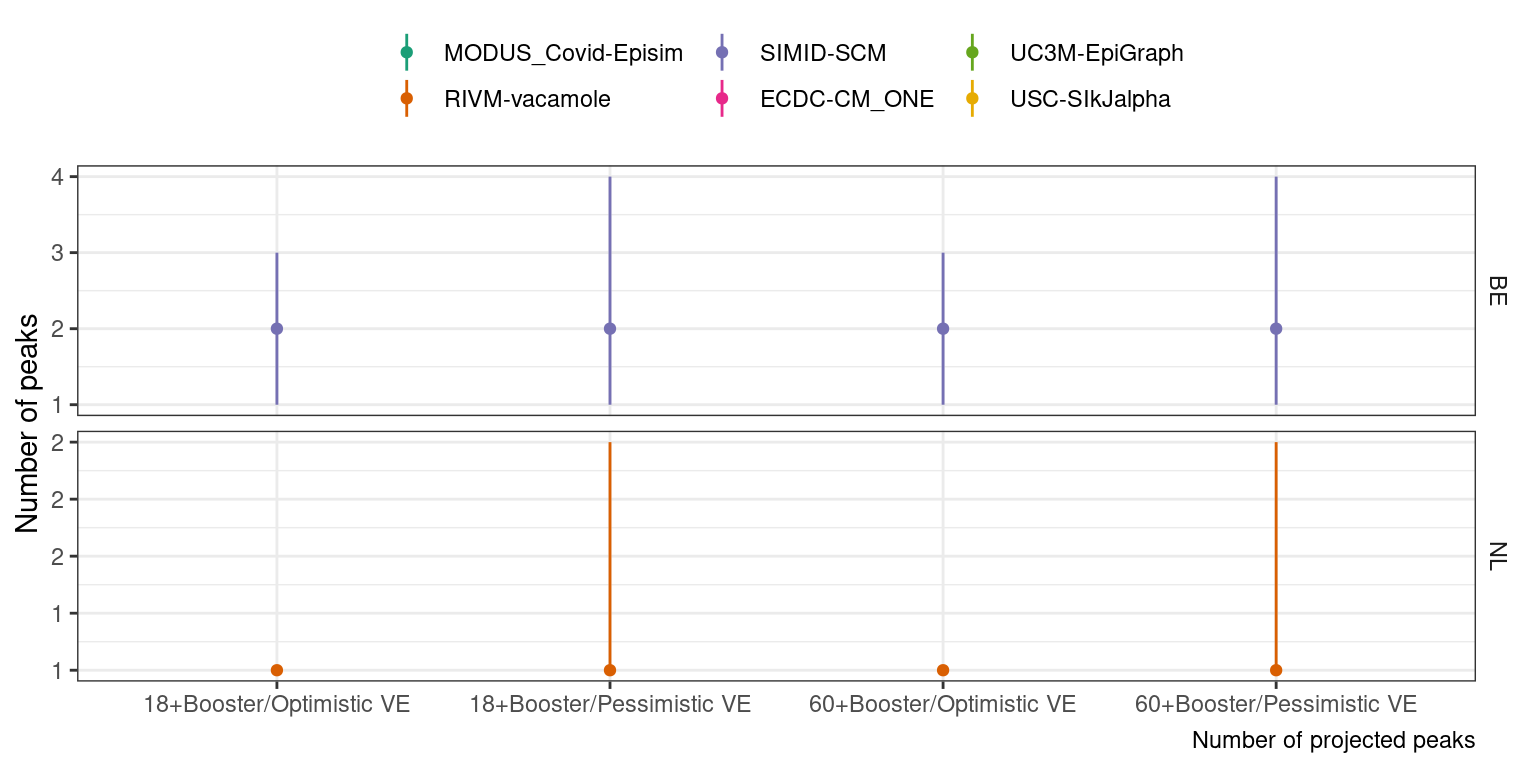
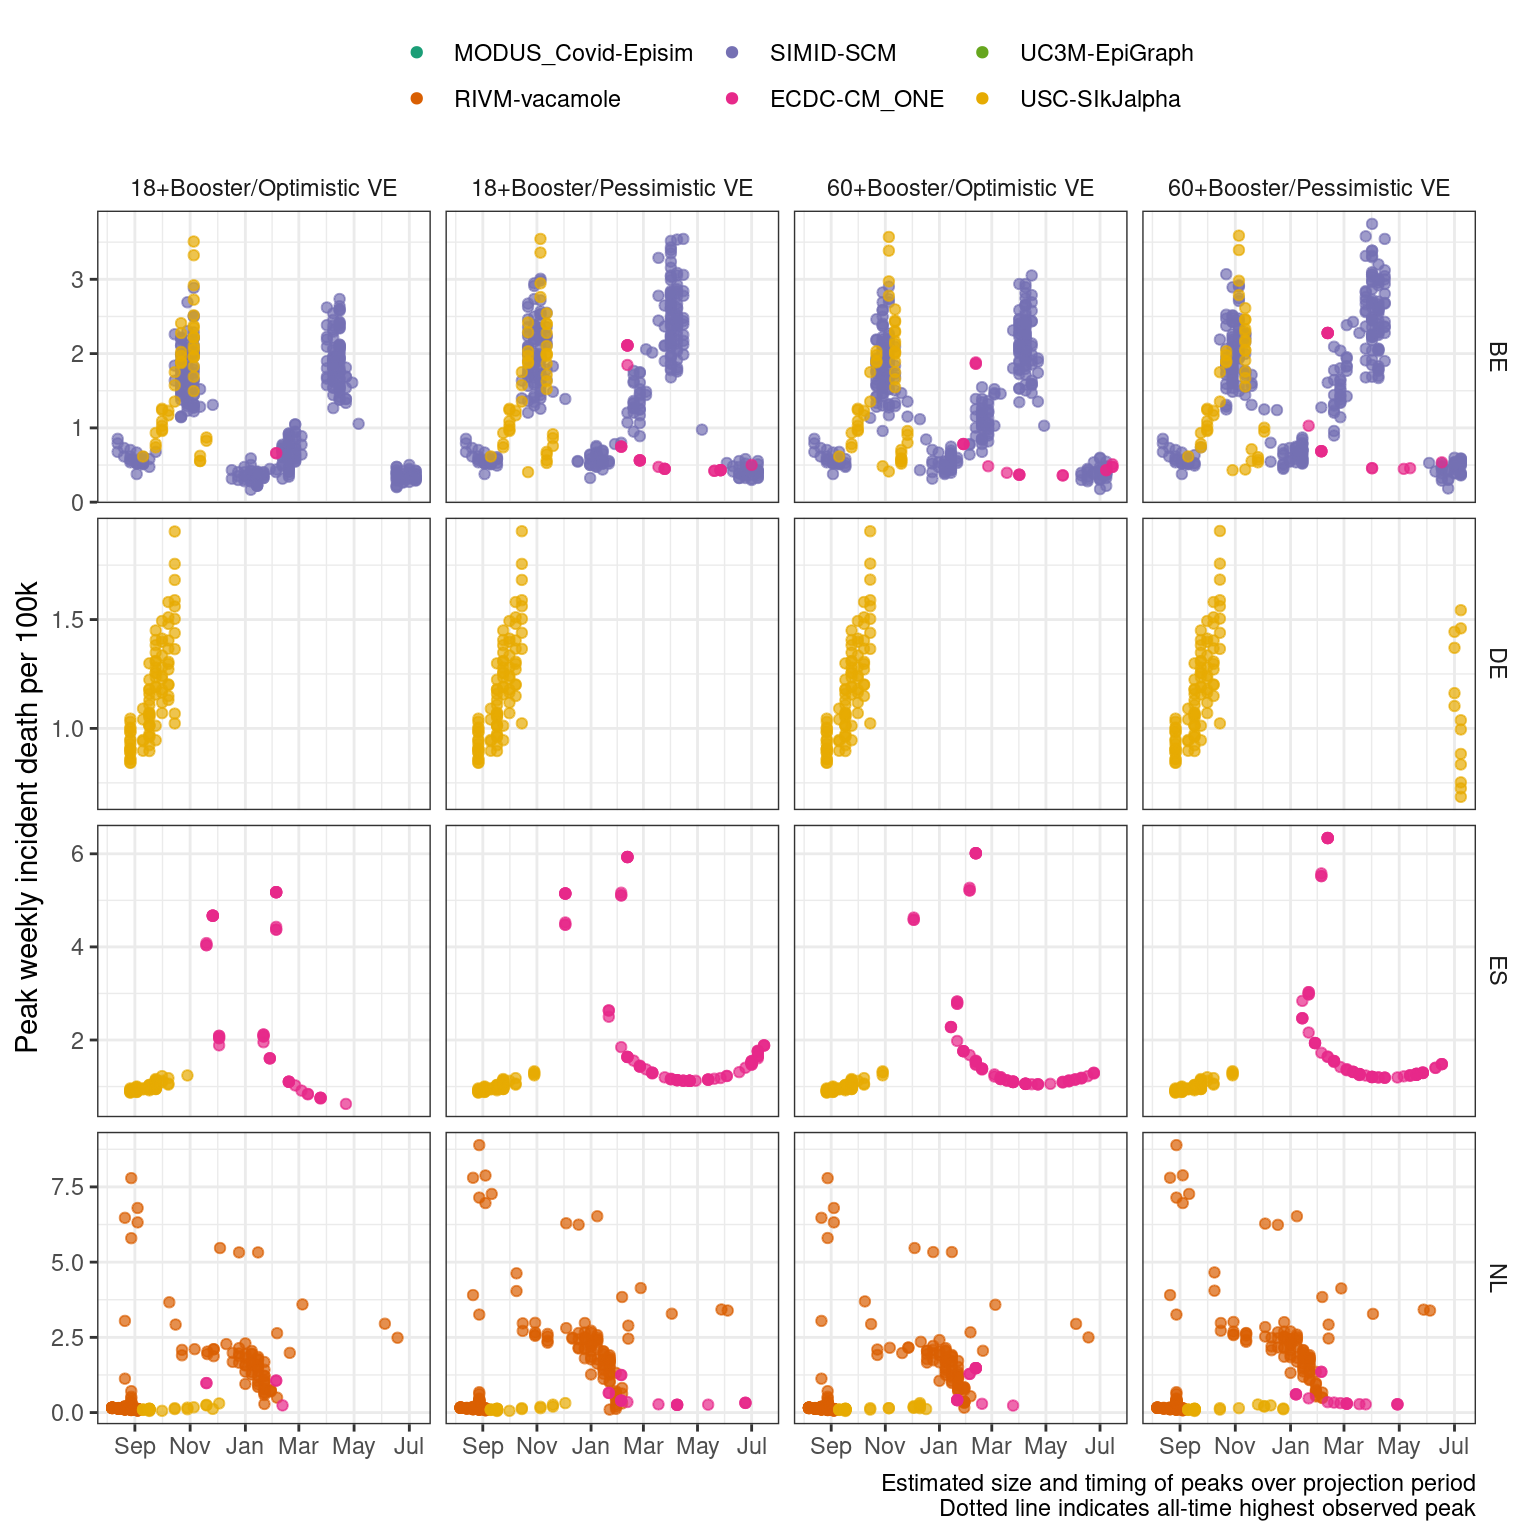
Death
A. Size and timing of peaks. Boxplots show summary of the likely value at peak incidence (median and interquartile range); points show timing and size of peaks from independent sample simulations
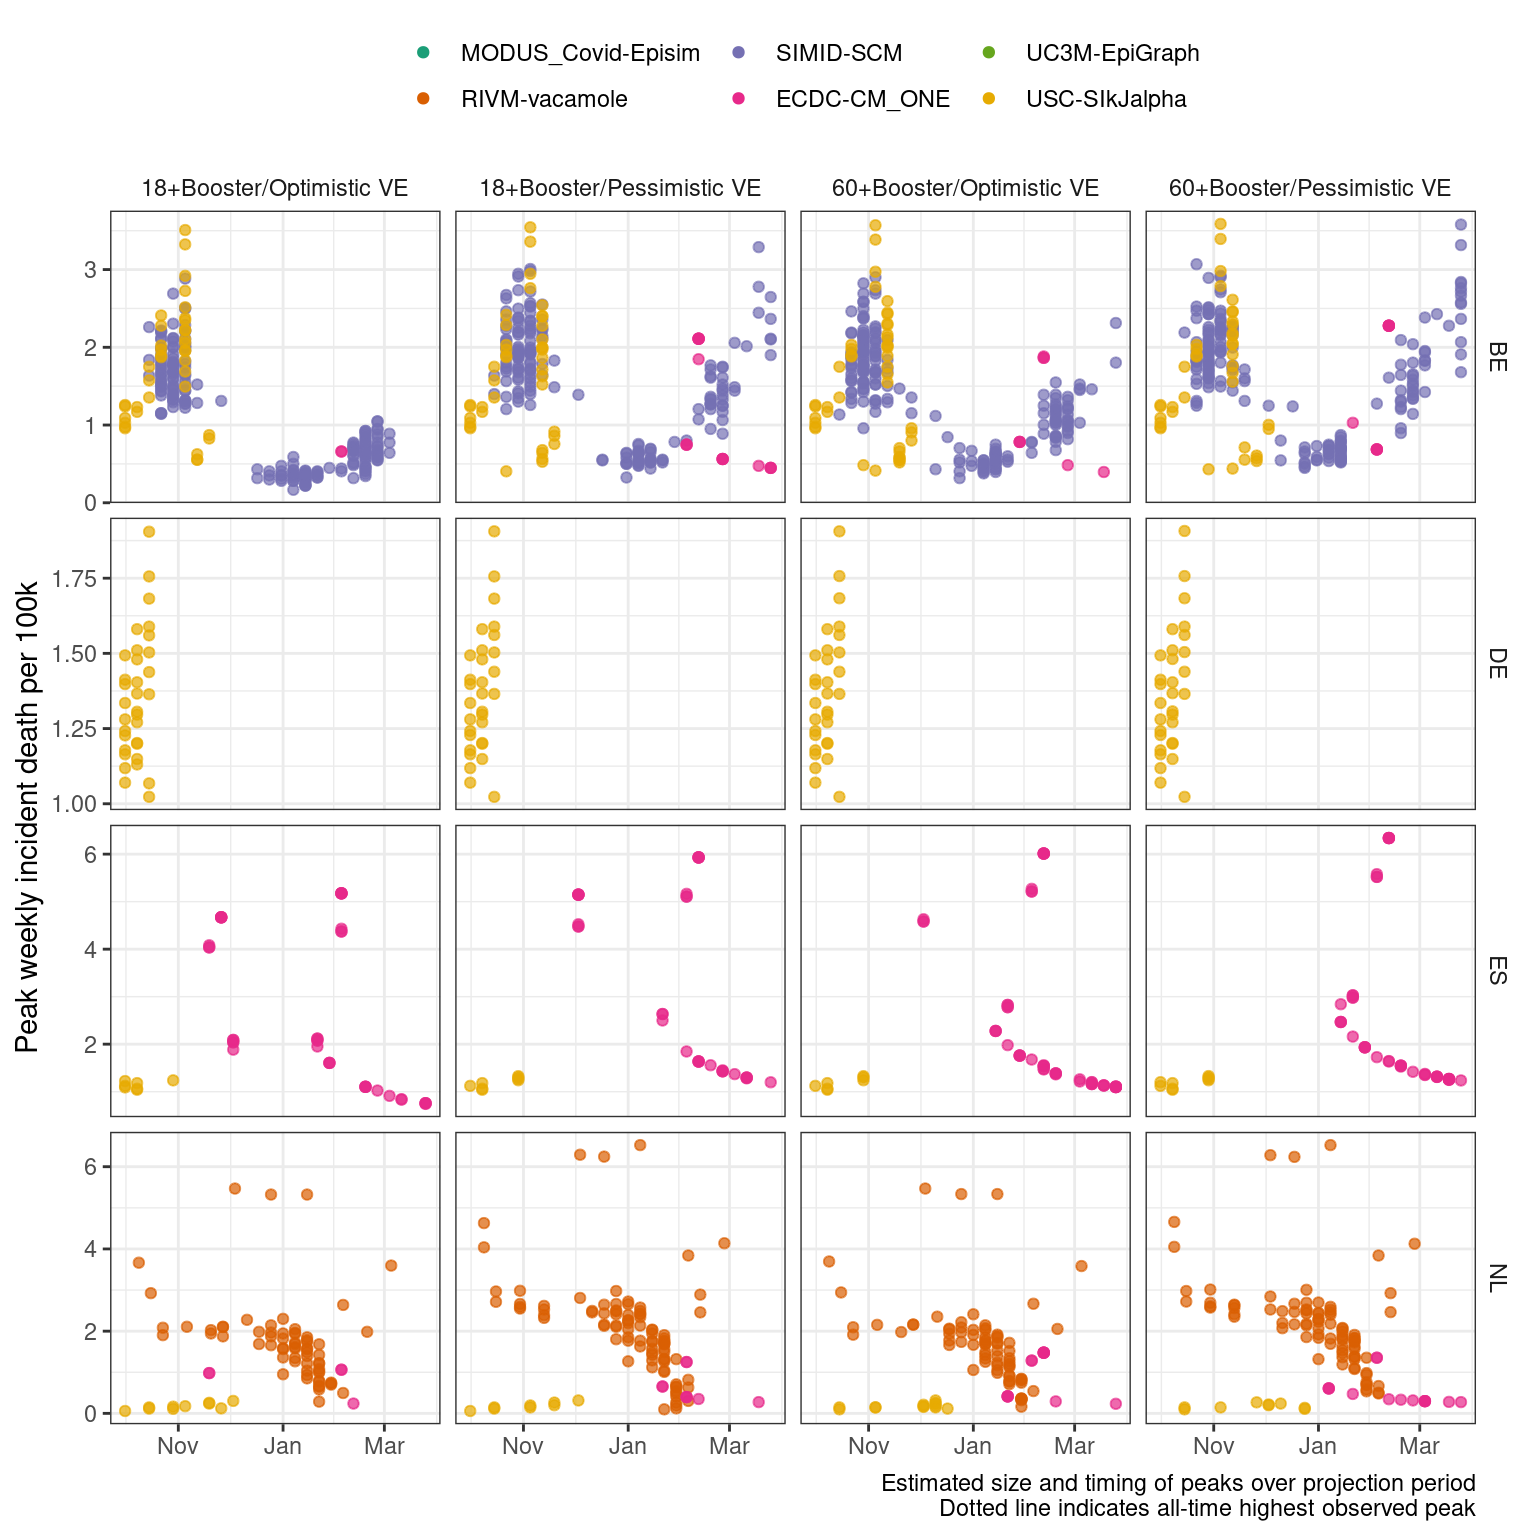
B. Projected number of peaks (median with 5-95% probability)
Scenarios: Autumn second booster campaign among population aged ‘18+’ or ‘60+’; Vaccine effectiveness is ‘optimistic’(effectiveness as of a booster vaccine against Delta) or ‘pessimistic’ (as against BA.4/BA.5/BA.2.75)
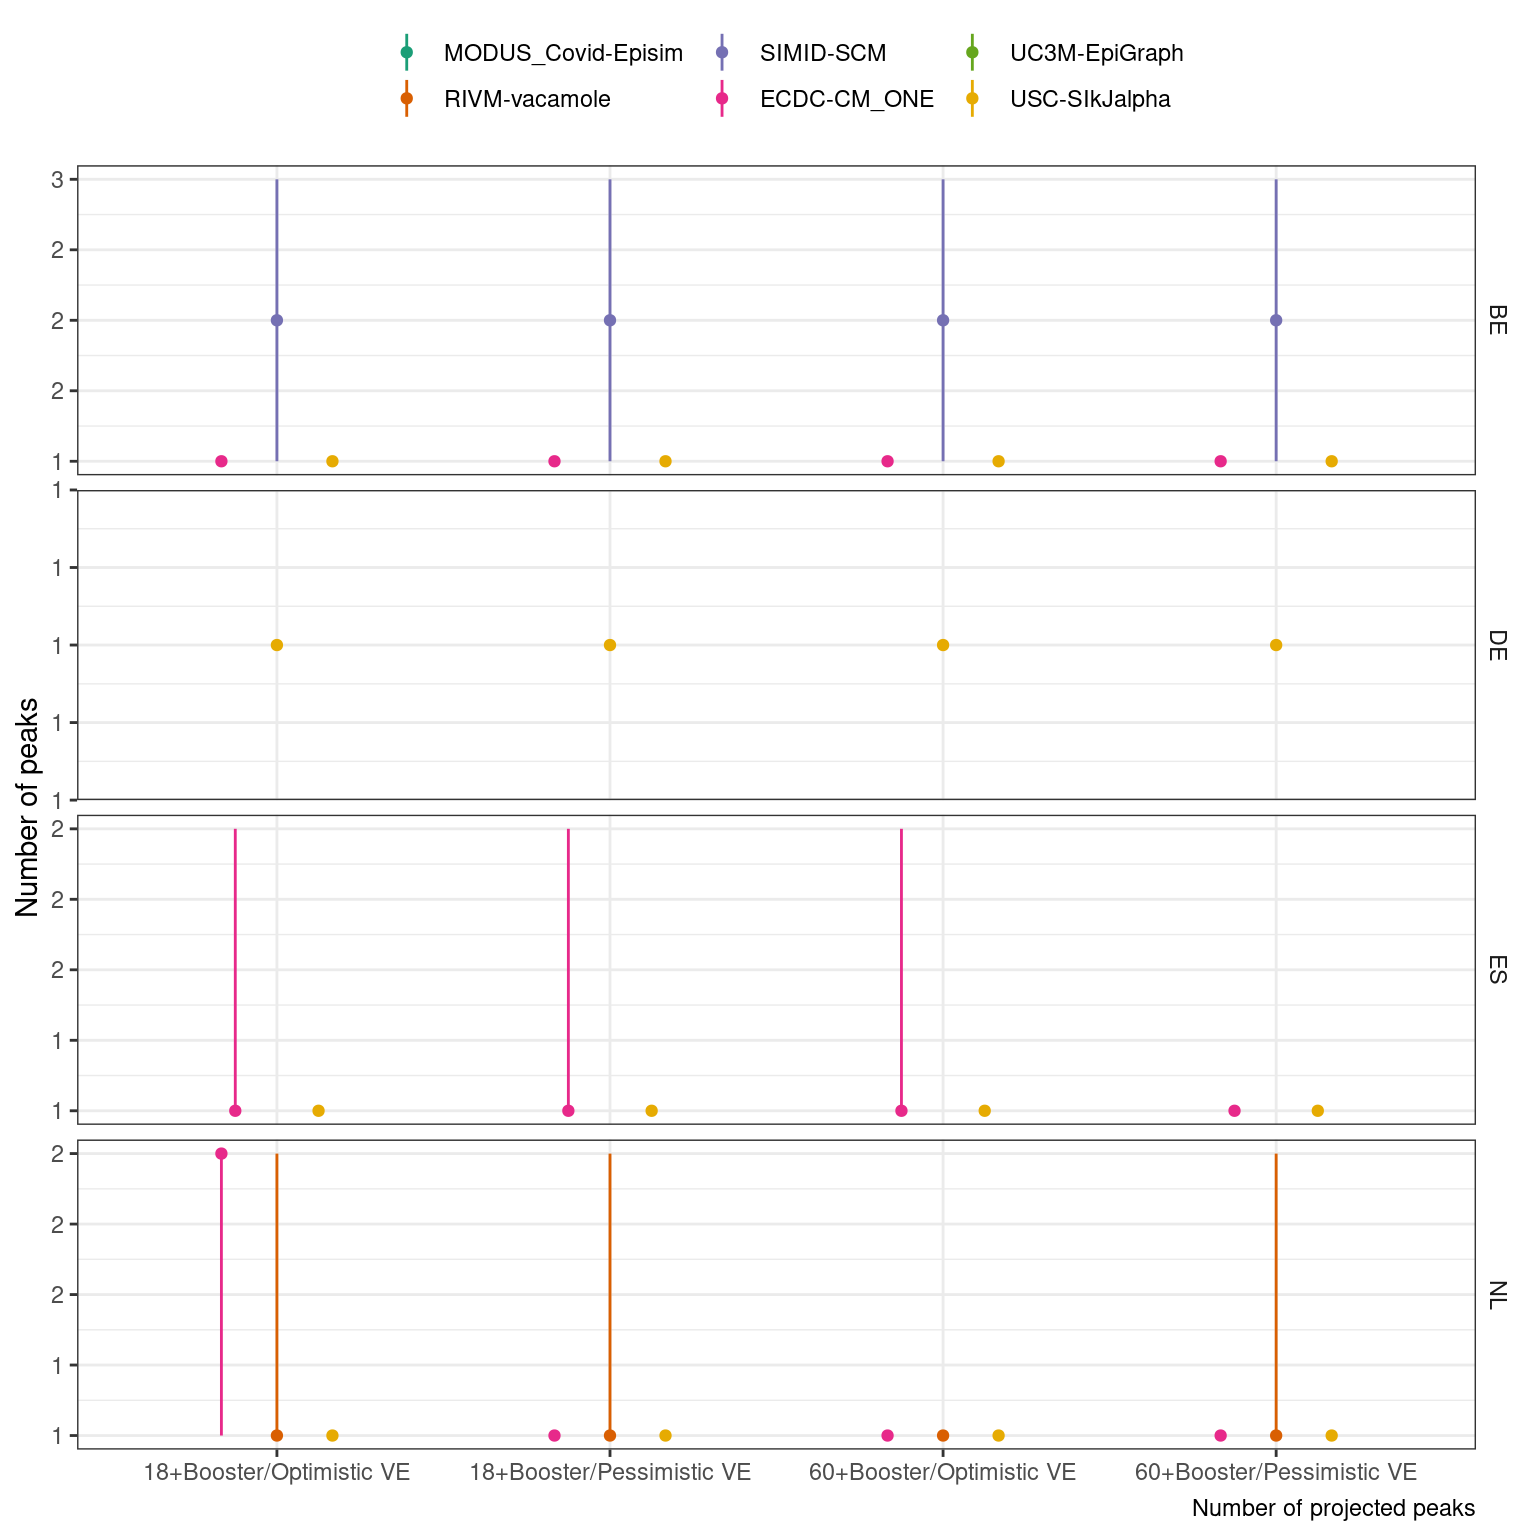
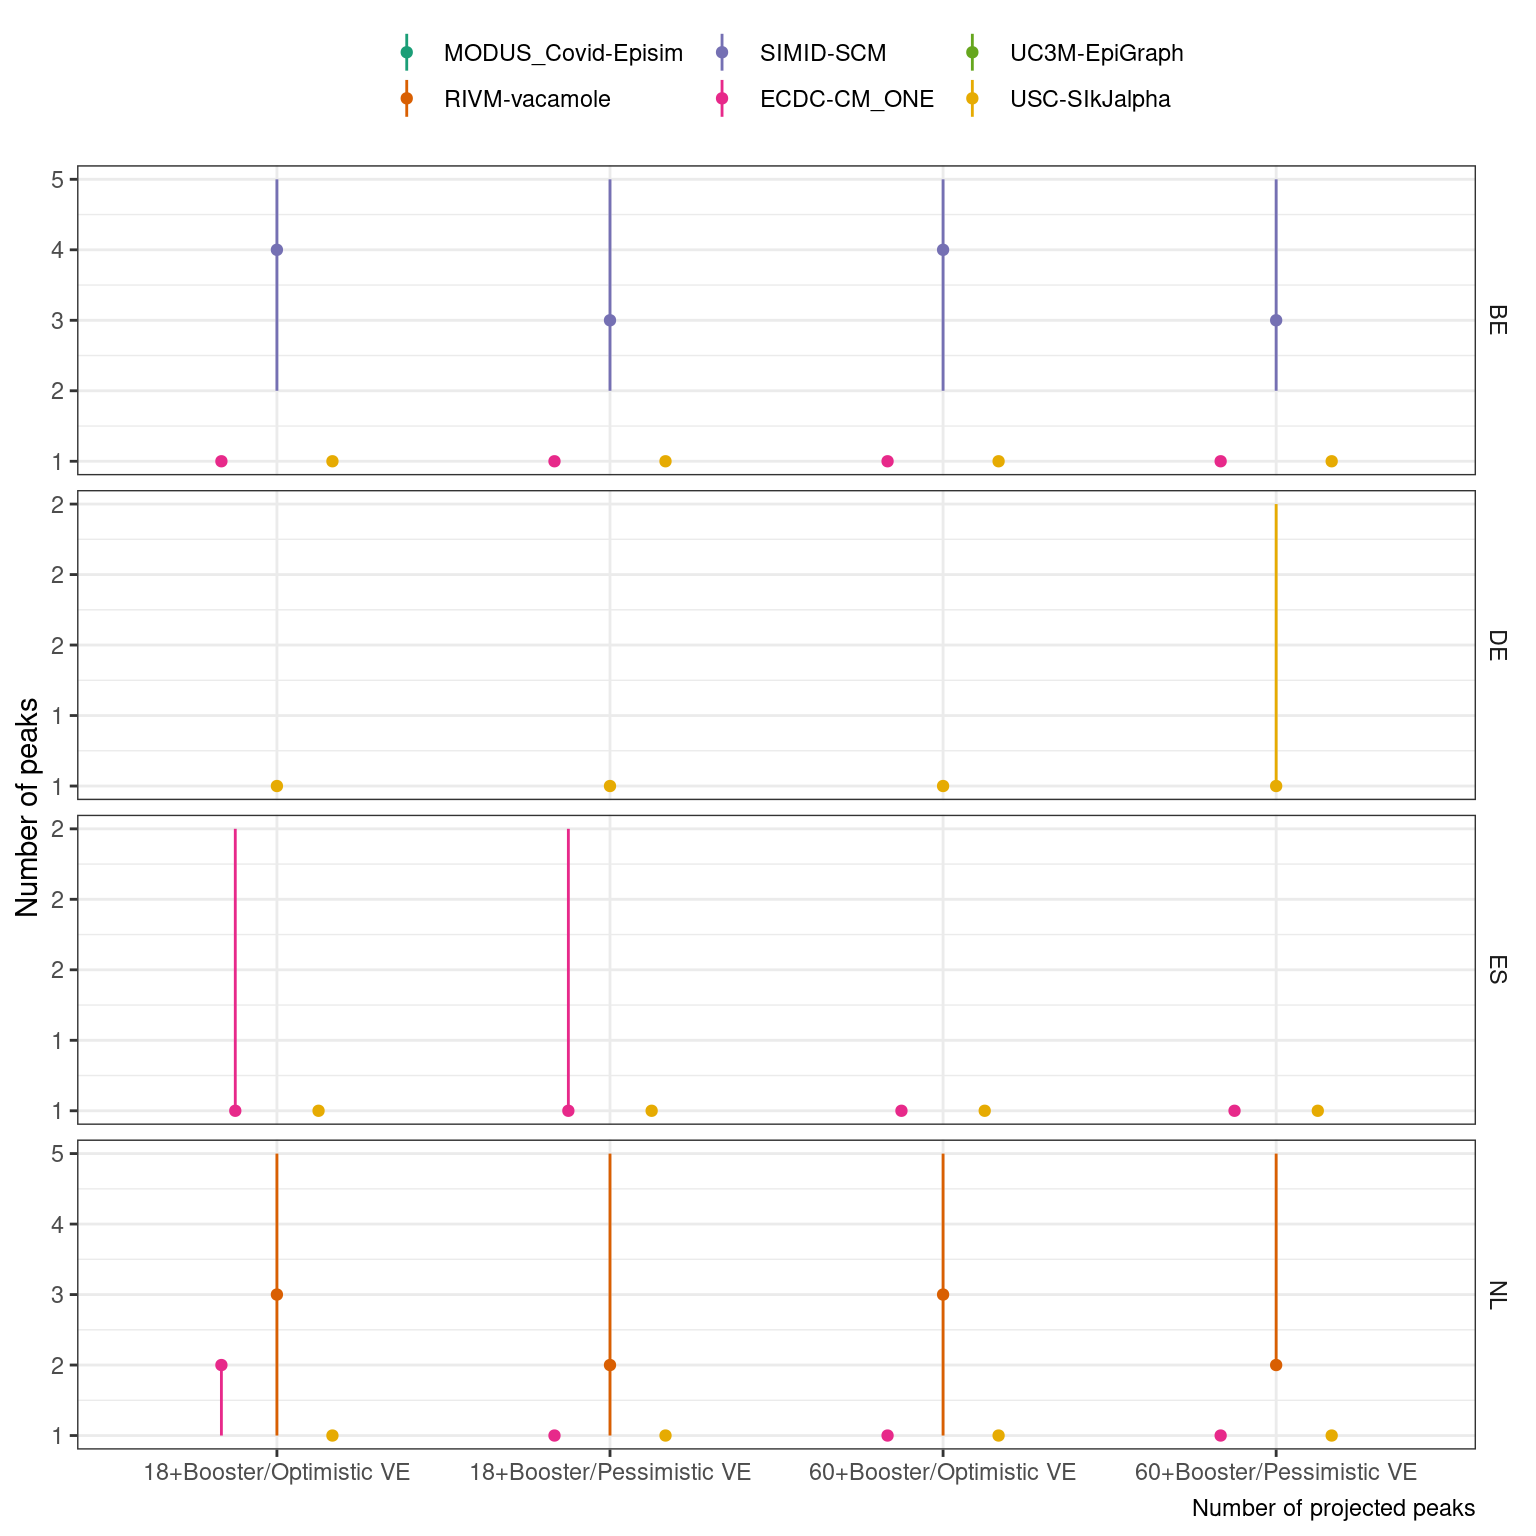
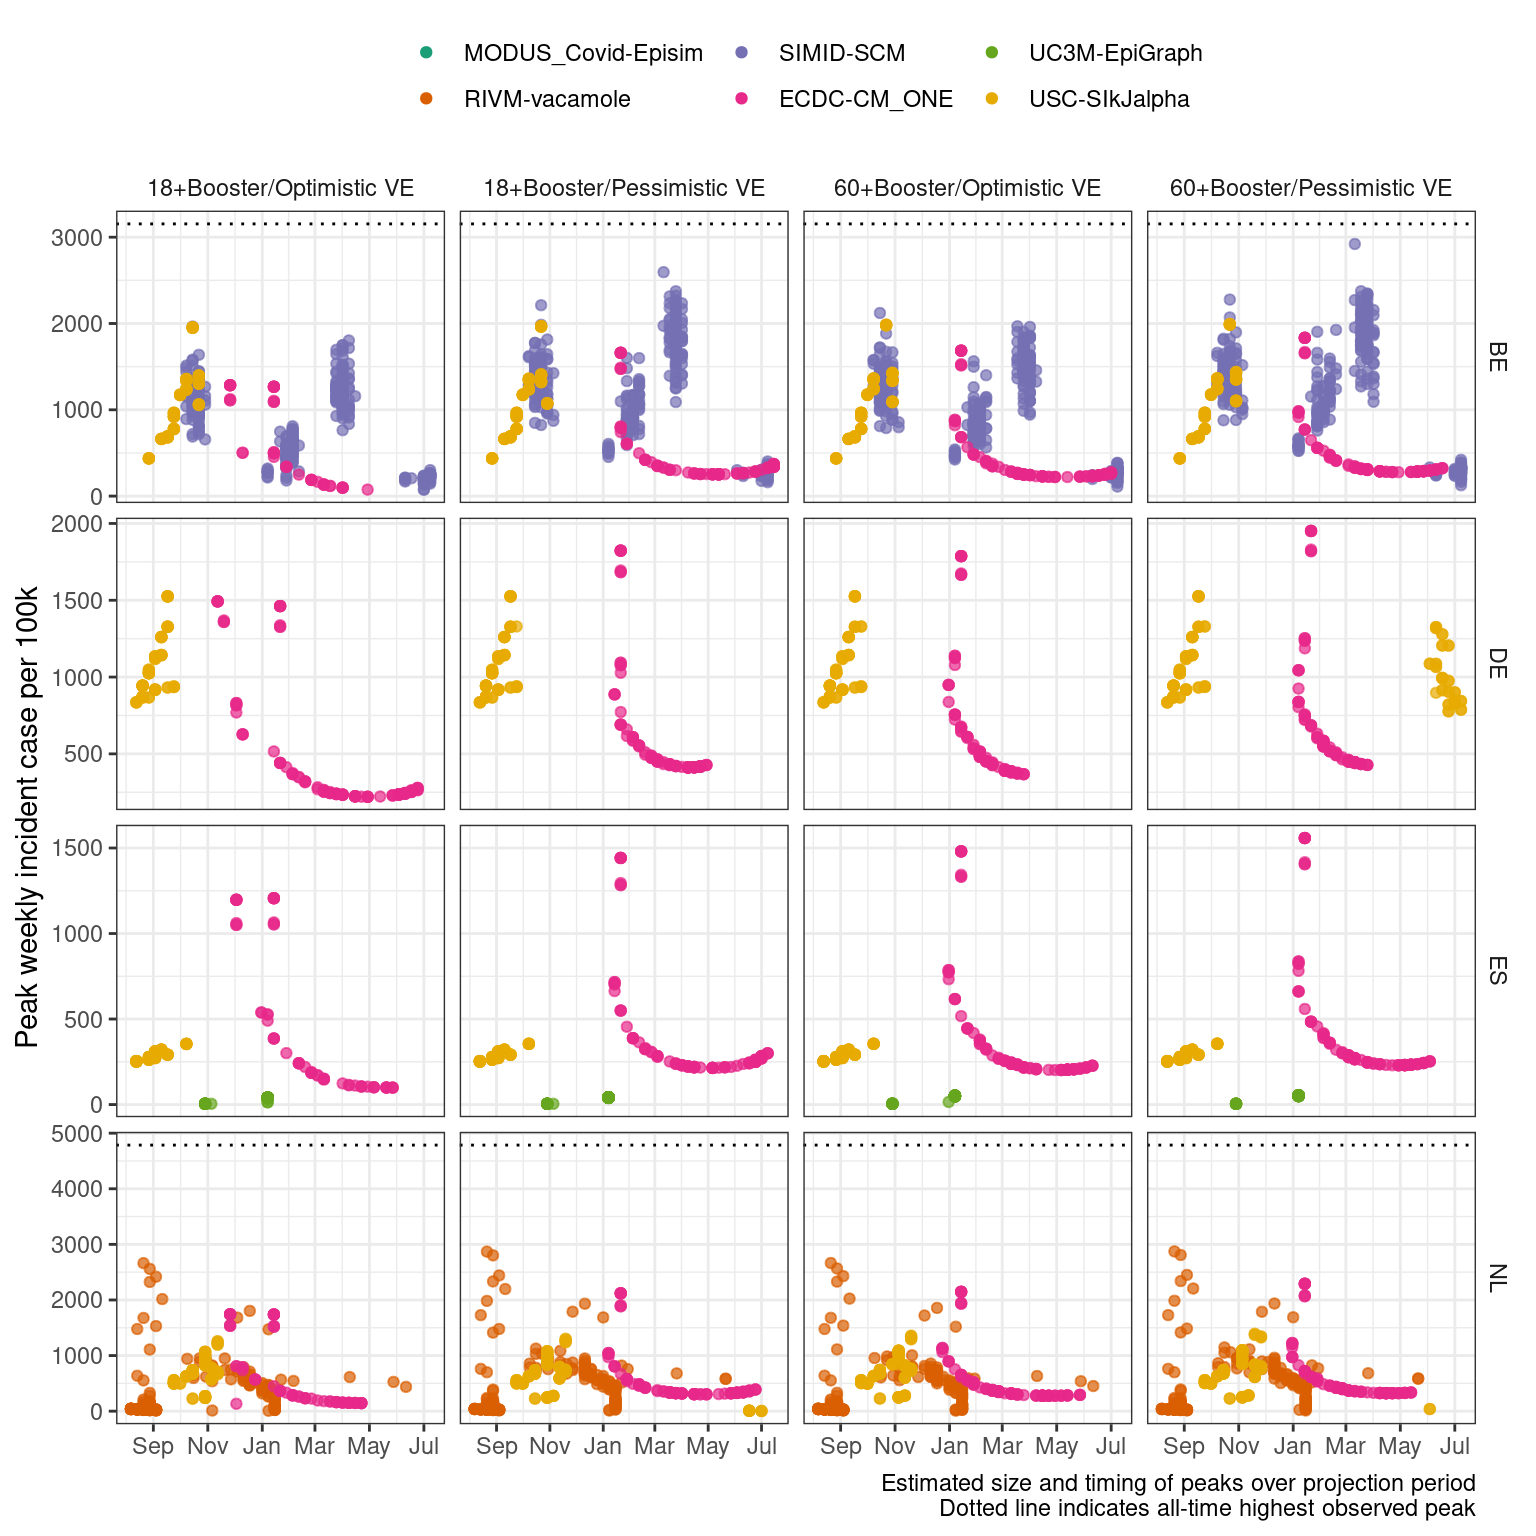
Case
A. Size and timing of peaks. Boxplots show summary of the likely value at peak incidence (median and interquartile range); points show timing and size of peaks from independent sample simulations
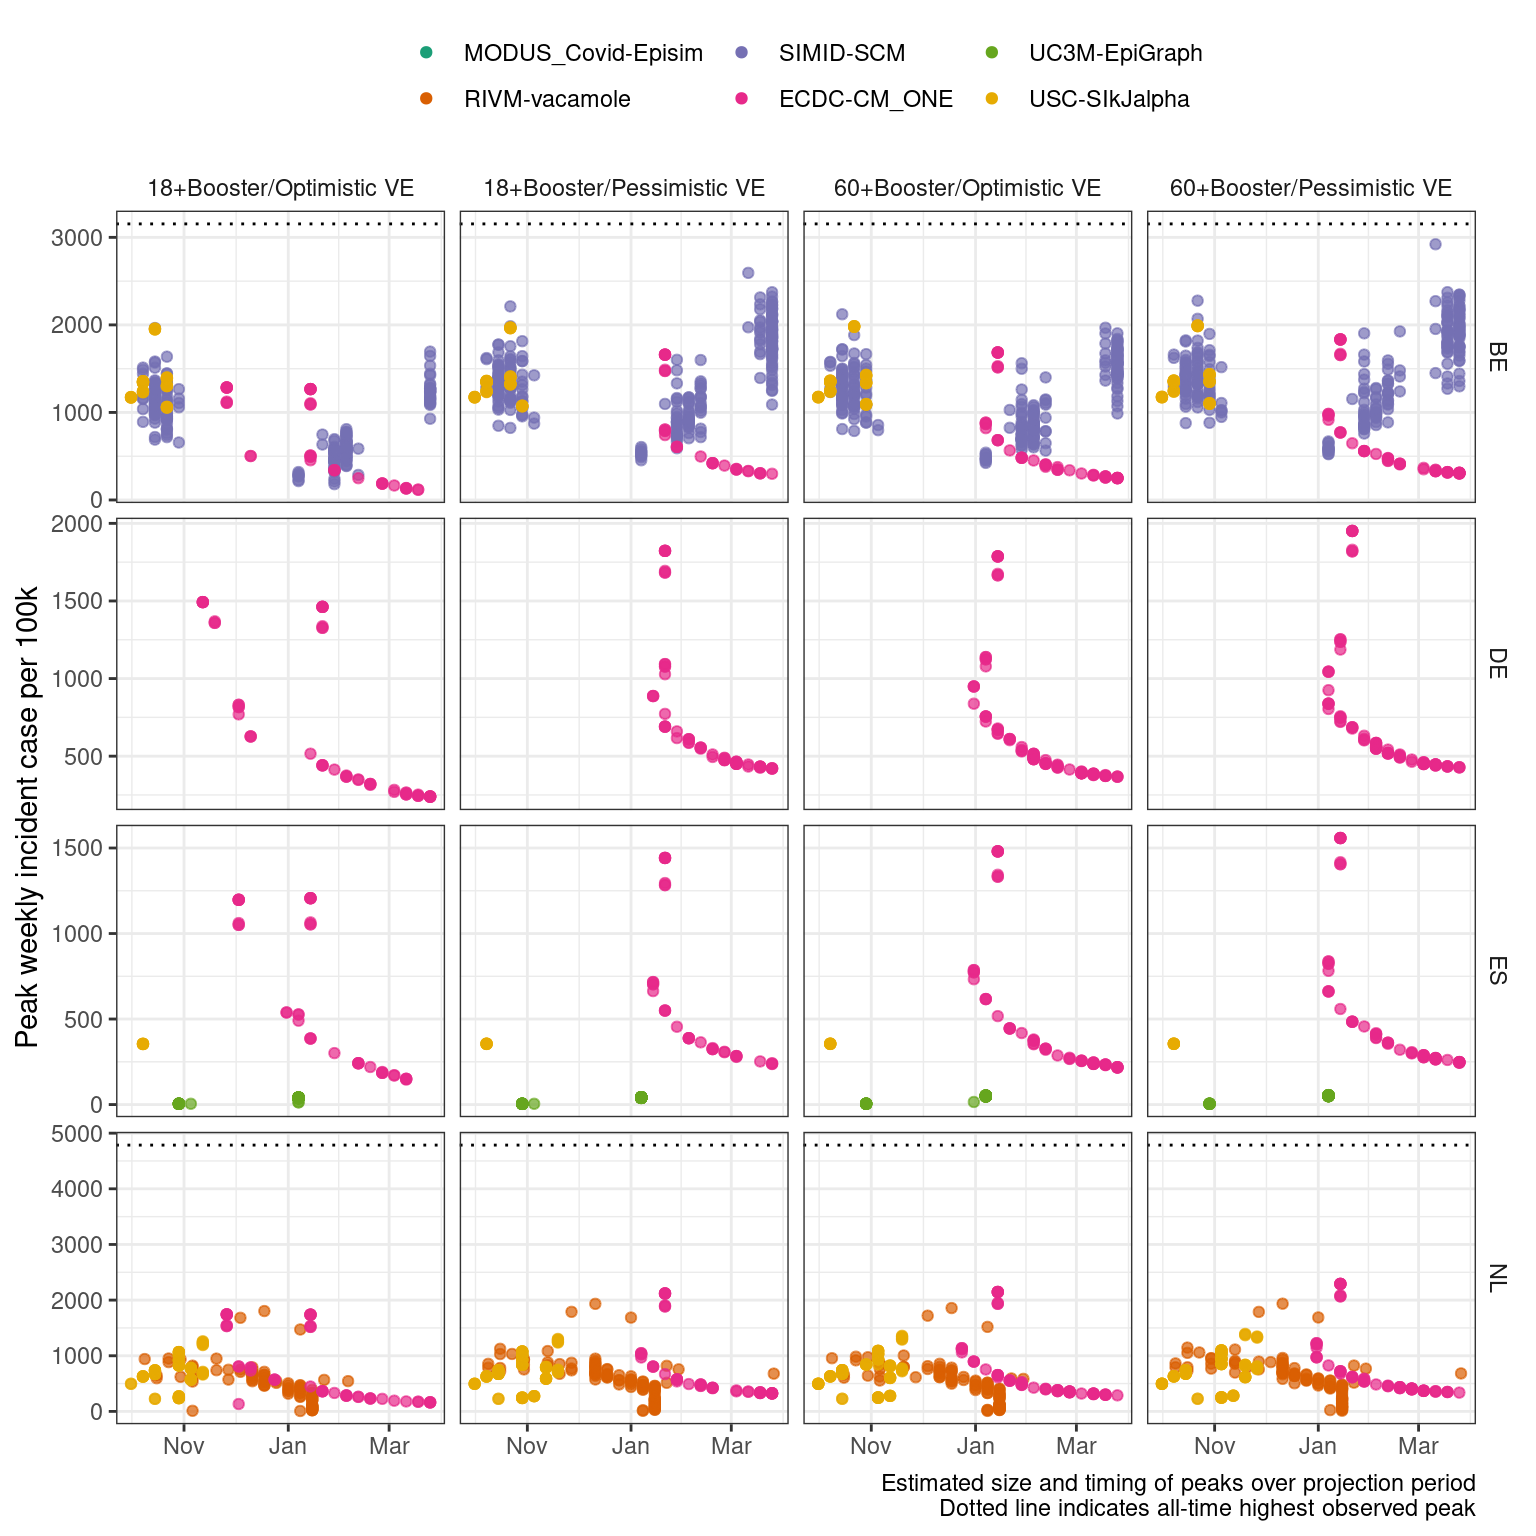
B. Projected number of peaks (median with 5-95% probability)
Scenarios: Autumn second booster campaign among population aged ‘18+’ or ‘60+’; Vaccine effectiveness is ‘optimistic’(effectiveness as of a booster vaccine against Delta) or ‘pessimistic’ (as against BA.4/BA.5/BA.2.75)
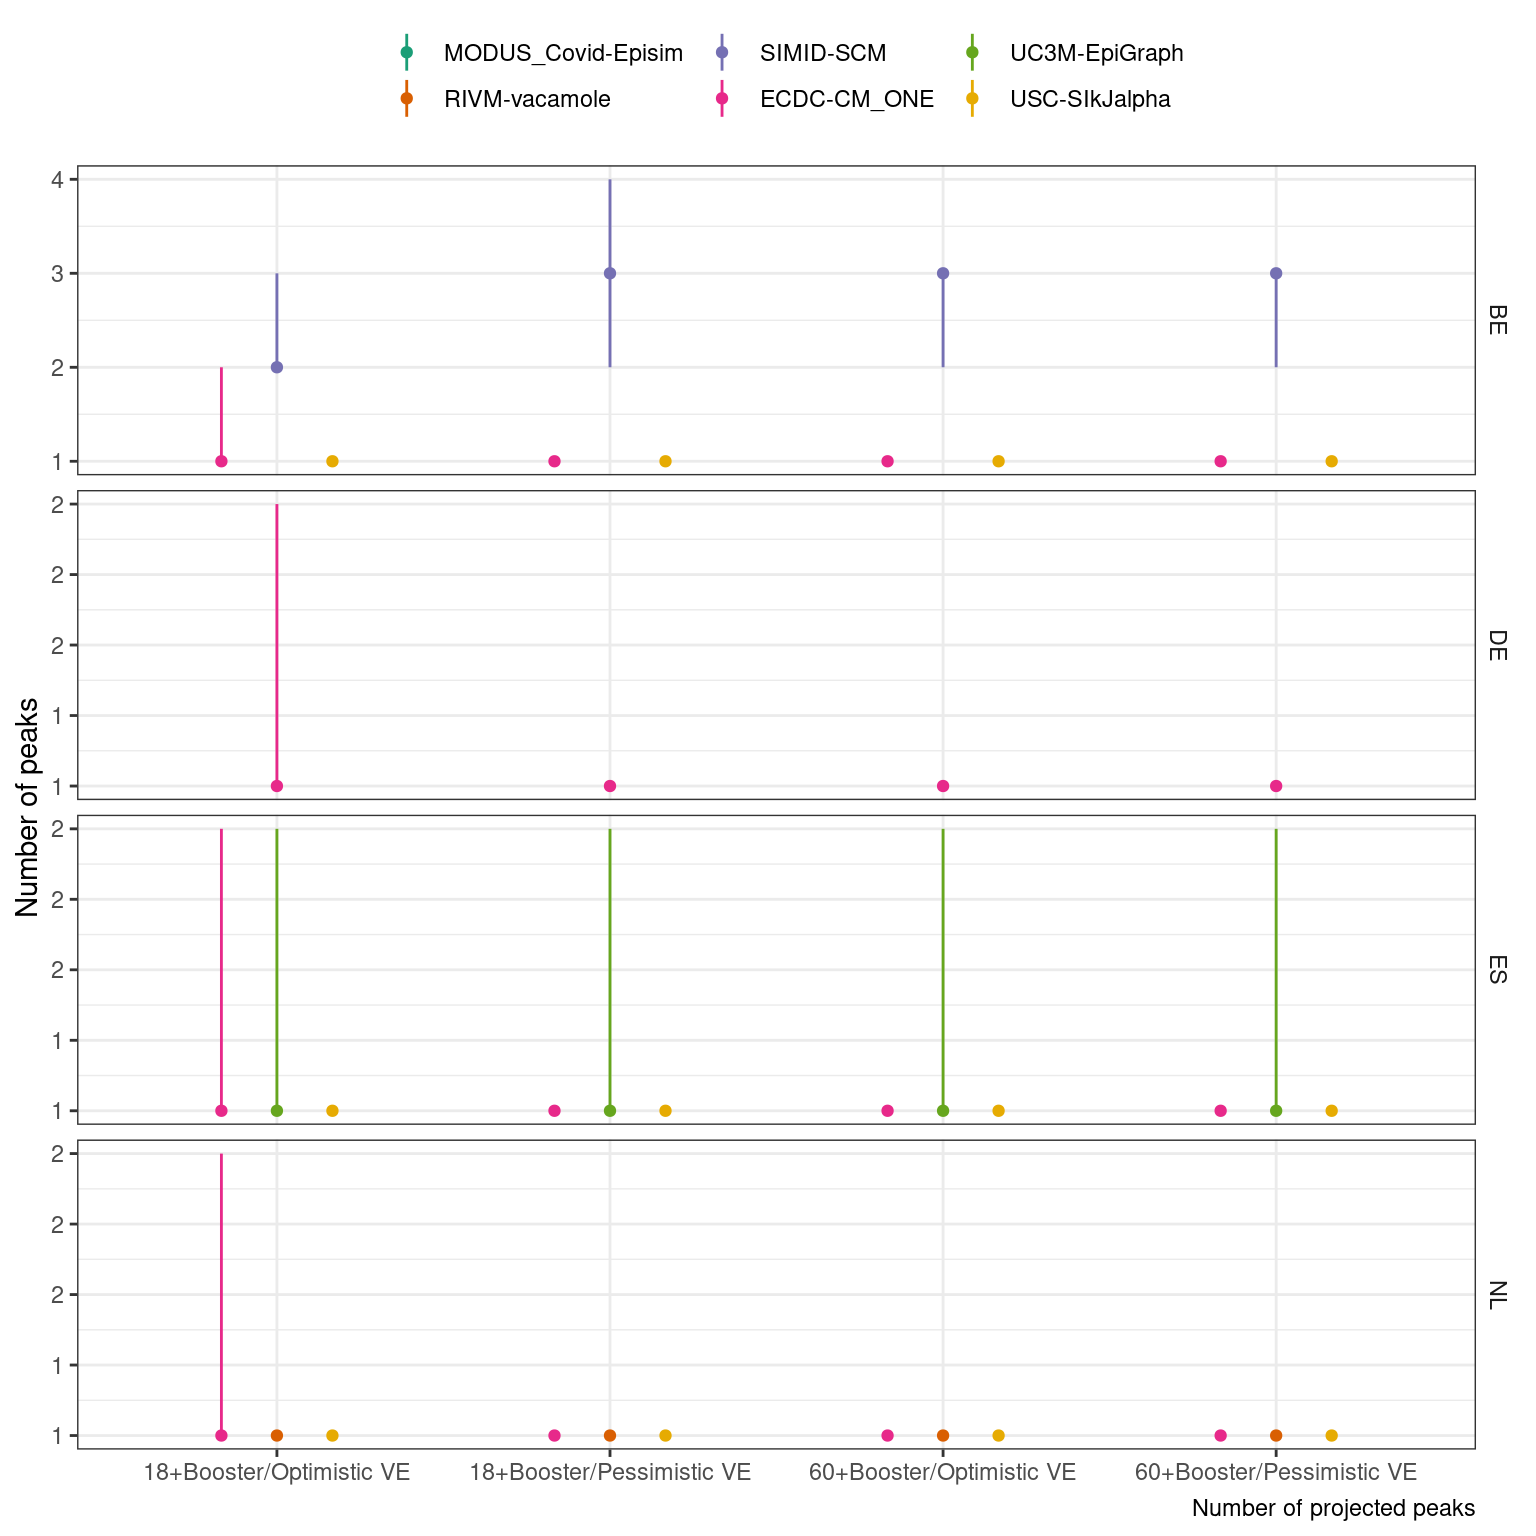
Infection
A. Size and timing of peaks. Boxplots show summary of the likely value at peak incidence (median and interquartile range); points show timing and size of peaks from independent sample simulations
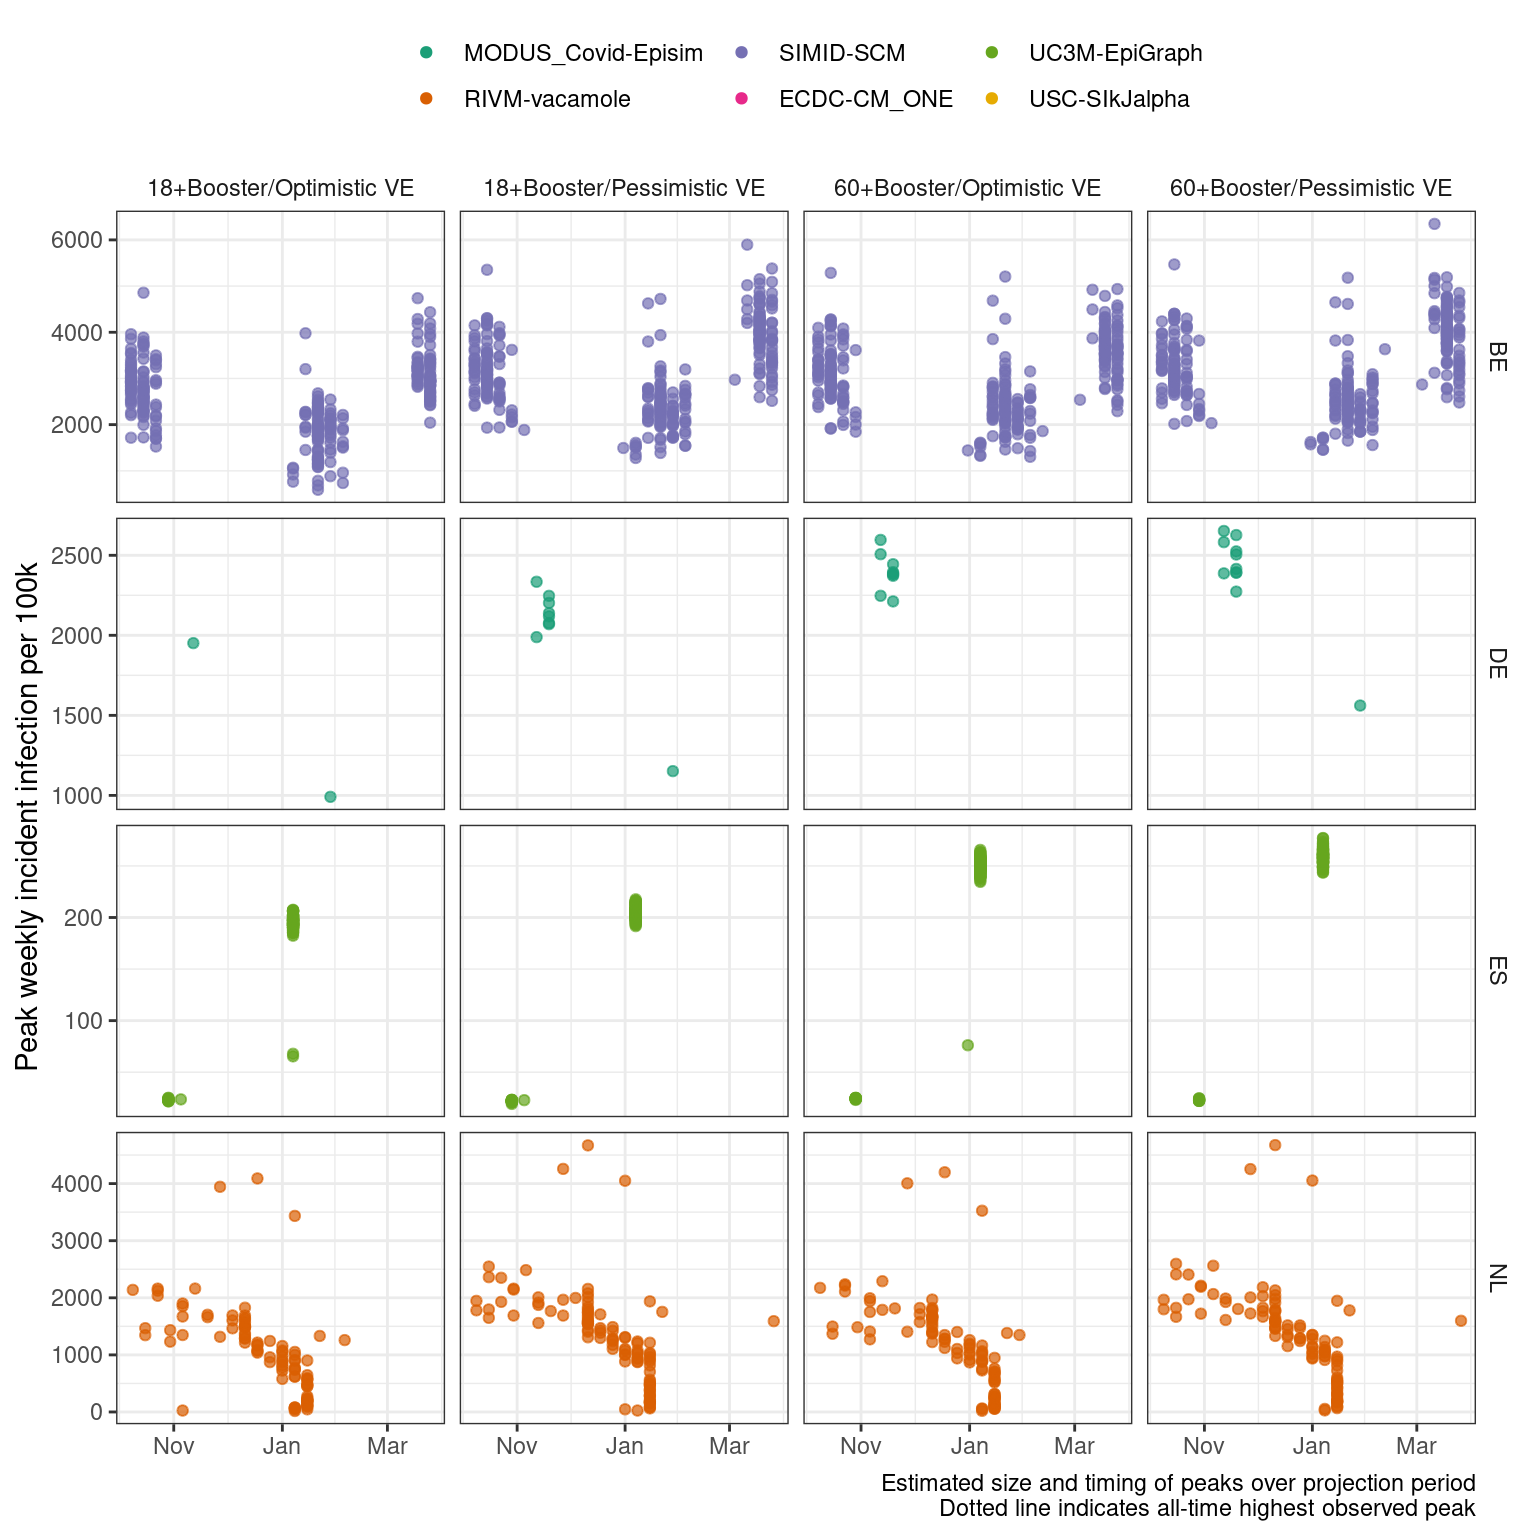
B. Projected number of peaks (median with 5-95% probability)
Scenarios: Autumn second booster campaign among population aged ‘18+’ or ‘60+’; Vaccine effectiveness is ‘optimistic’(effectiveness as of a booster vaccine against Delta) or ‘pessimistic’ (as against BA.4/BA.5/BA.2.75)
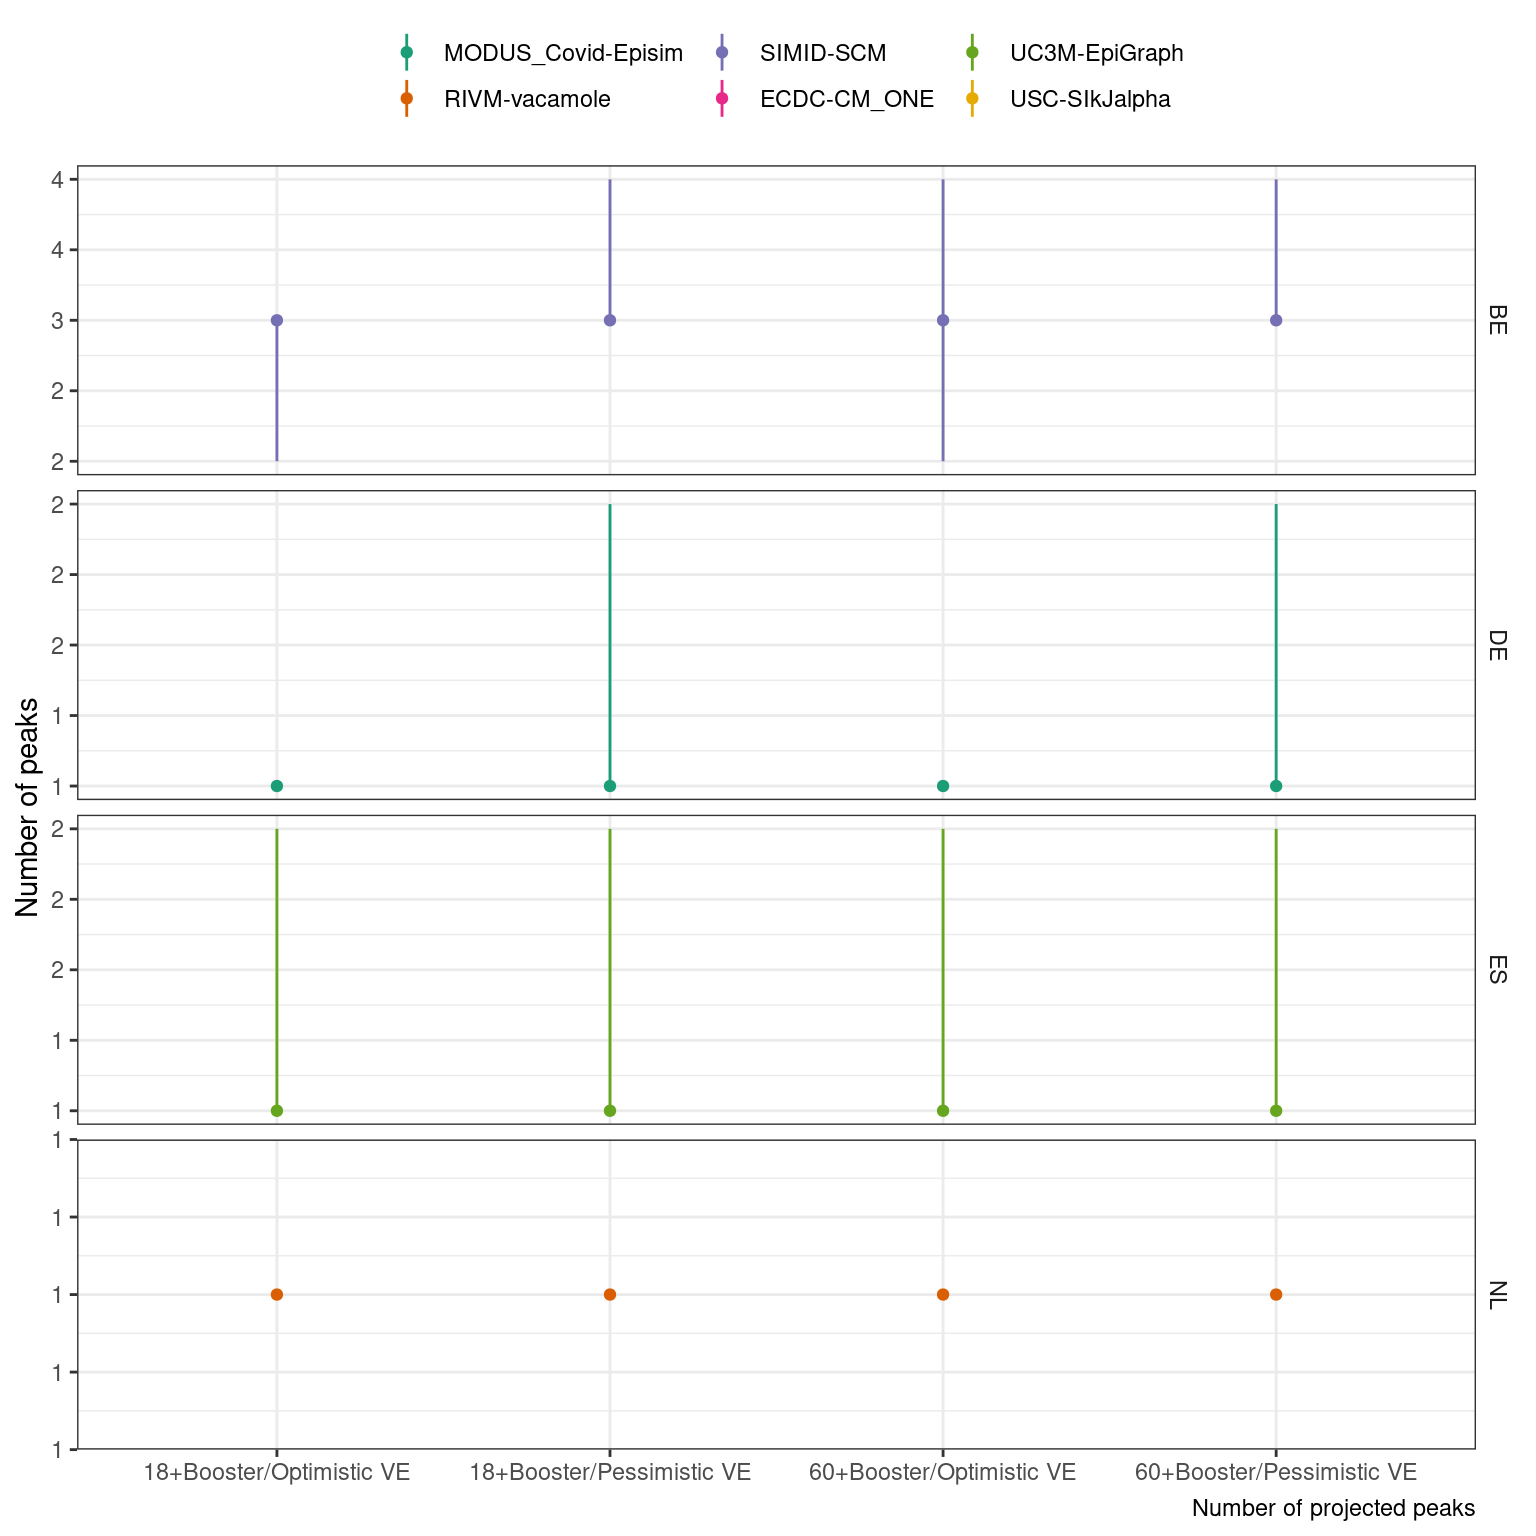
Hosp
A. Size and timing of peaks. Boxplots show summary of the likely value at peak incidence (median and interquartile range); points show timing and size of peaks from independent sample simulations
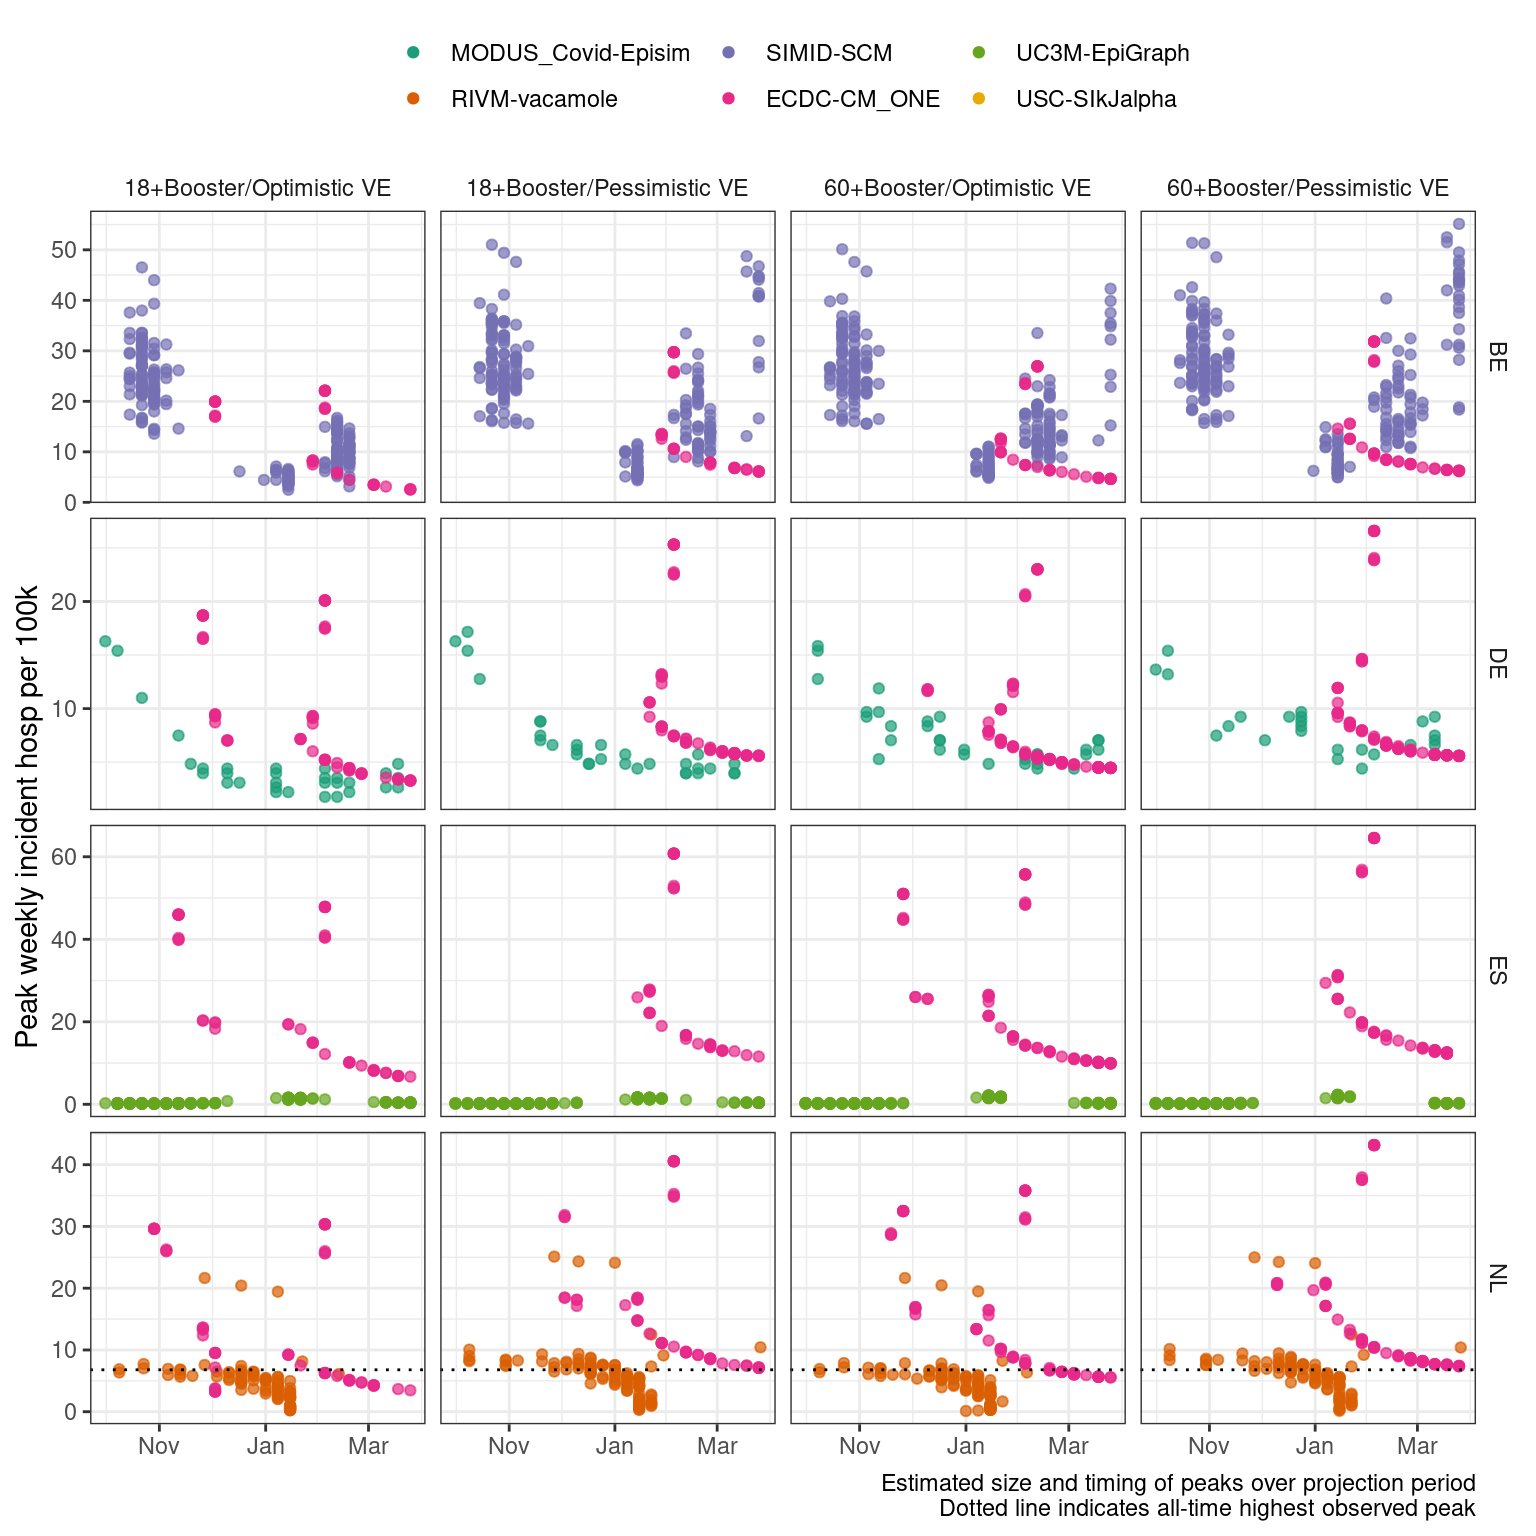
B. Projected number of peaks (median with 5-95% probability)
Scenarios: Autumn second booster campaign among population aged ‘18+’ or ‘60+’; Vaccine effectiveness is ‘optimistic’(effectiveness as of a booster vaccine against Delta) or ‘pessimistic’ (as against BA.4/BA.5/BA.2.75)
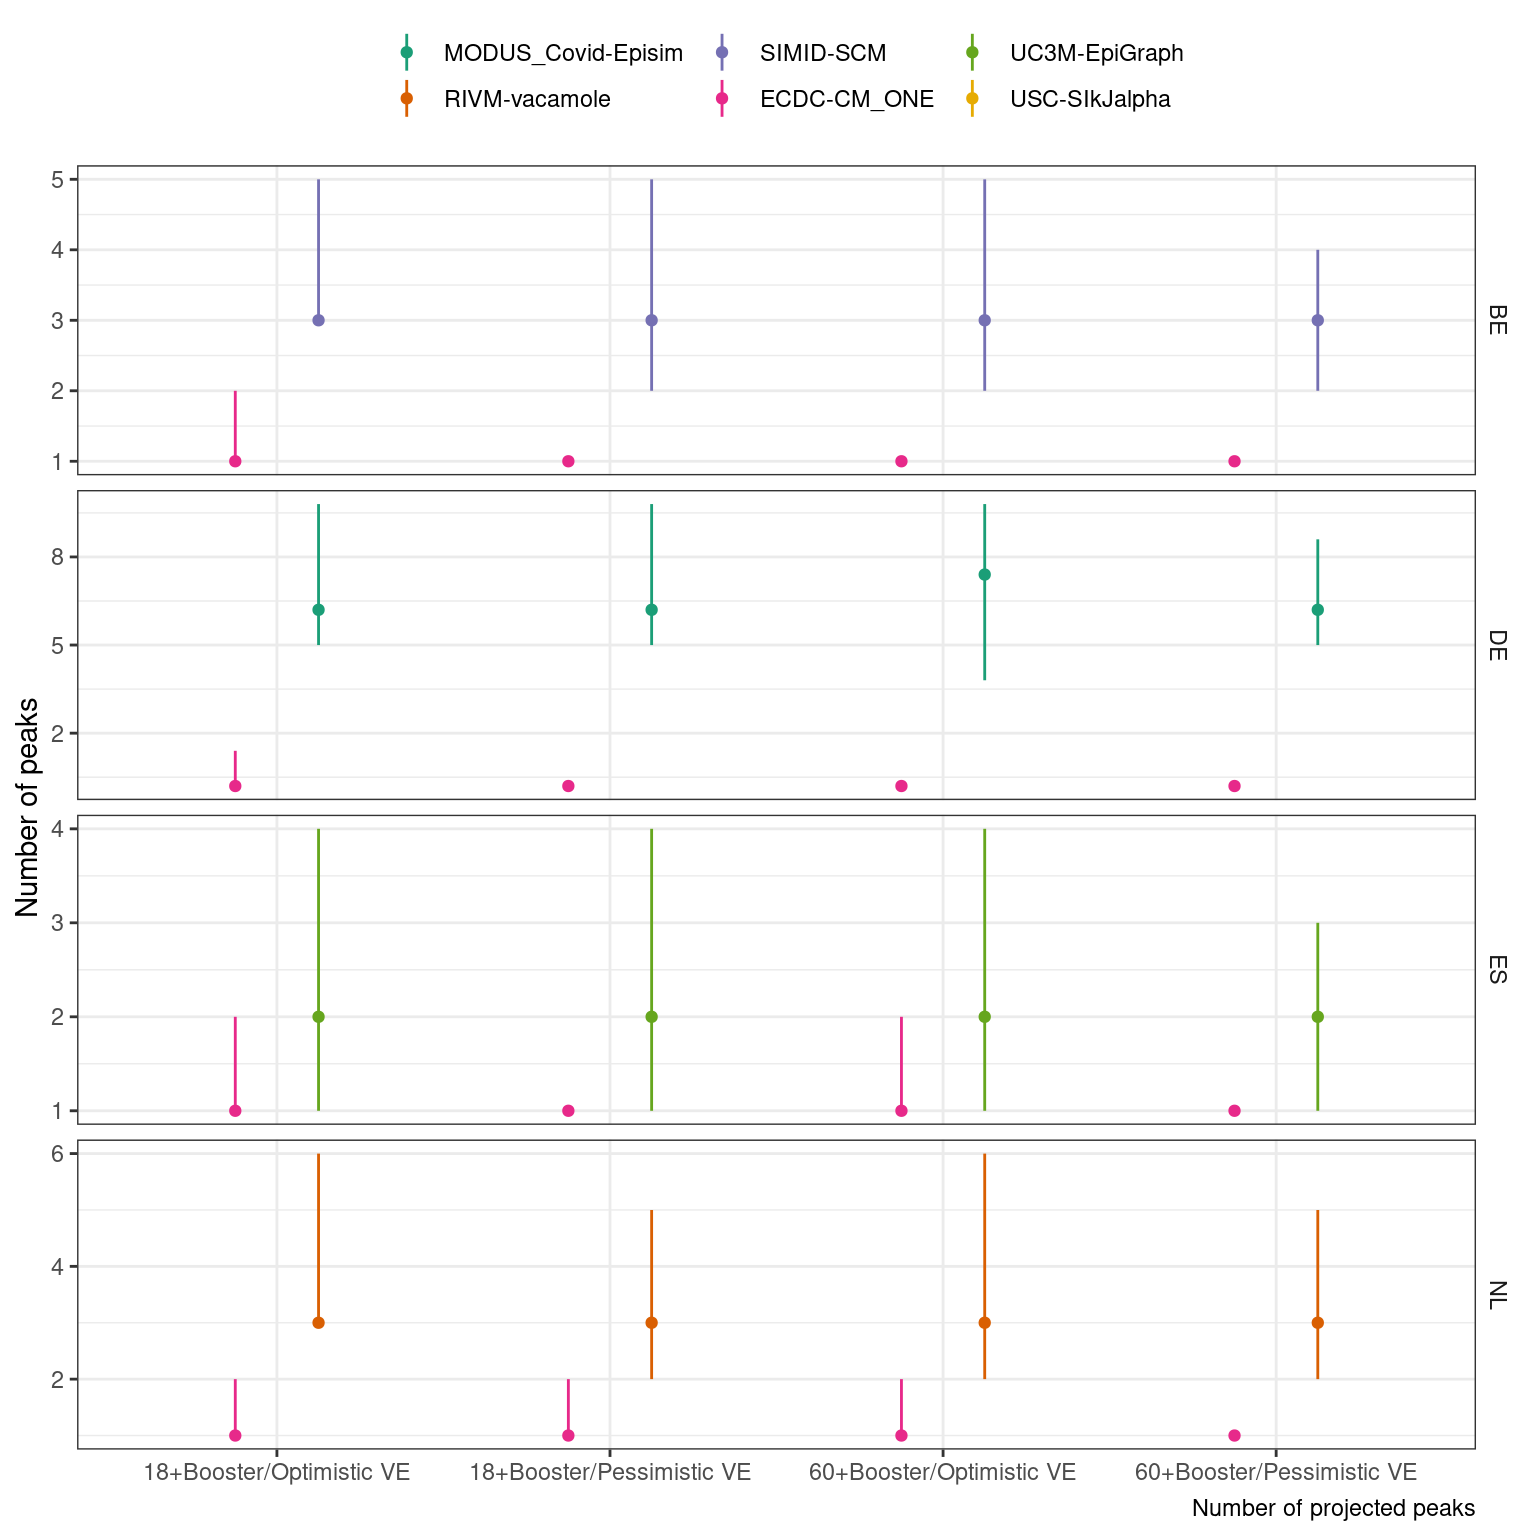
Icu
A. Size and timing of peaks. Boxplots show summary of the likely value at peak incidence (median and interquartile range); points show timing and size of peaks from independent sample simulations
B. Projected number of peaks (median with 5-95% probability)
Scenarios: Autumn second booster campaign among population aged ‘18+’ or ‘60+’; Vaccine effectiveness is ‘optimistic’(effectiveness as of a booster vaccine against Delta) or ‘pessimistic’ (as against BA.4/BA.5/BA.2.75)
Entire projection period
Projections over June 2022 through June 2023
Death
A. Size and timing of peaks. Boxplots show summary of the likely value at peak incidence (median and interquartile range); points show timing and size of peaks from independent sample simulations
B. Projected number of peaks (median with 5-95% probability)
Scenarios: Autumn second booster campaign among population aged ‘18+’ or ‘60+’; Vaccine effectiveness is ‘optimistic’(effectiveness as of a booster vaccine against Delta) or ‘pessimistic’ (as against BA.4/BA.5/BA.2.75)
Case
A. Size and timing of peaks. Boxplots show summary of the likely value at peak incidence (median and interquartile range); points show timing and size of peaks from independent sample simulations
B. Projected number of peaks (median with 5-95% probability)
Scenarios: Autumn second booster campaign among population aged ‘18+’ or ‘60+’; Vaccine effectiveness is ‘optimistic’(effectiveness as of a booster vaccine against Delta) or ‘pessimistic’ (as against BA.4/BA.5/BA.2.75)
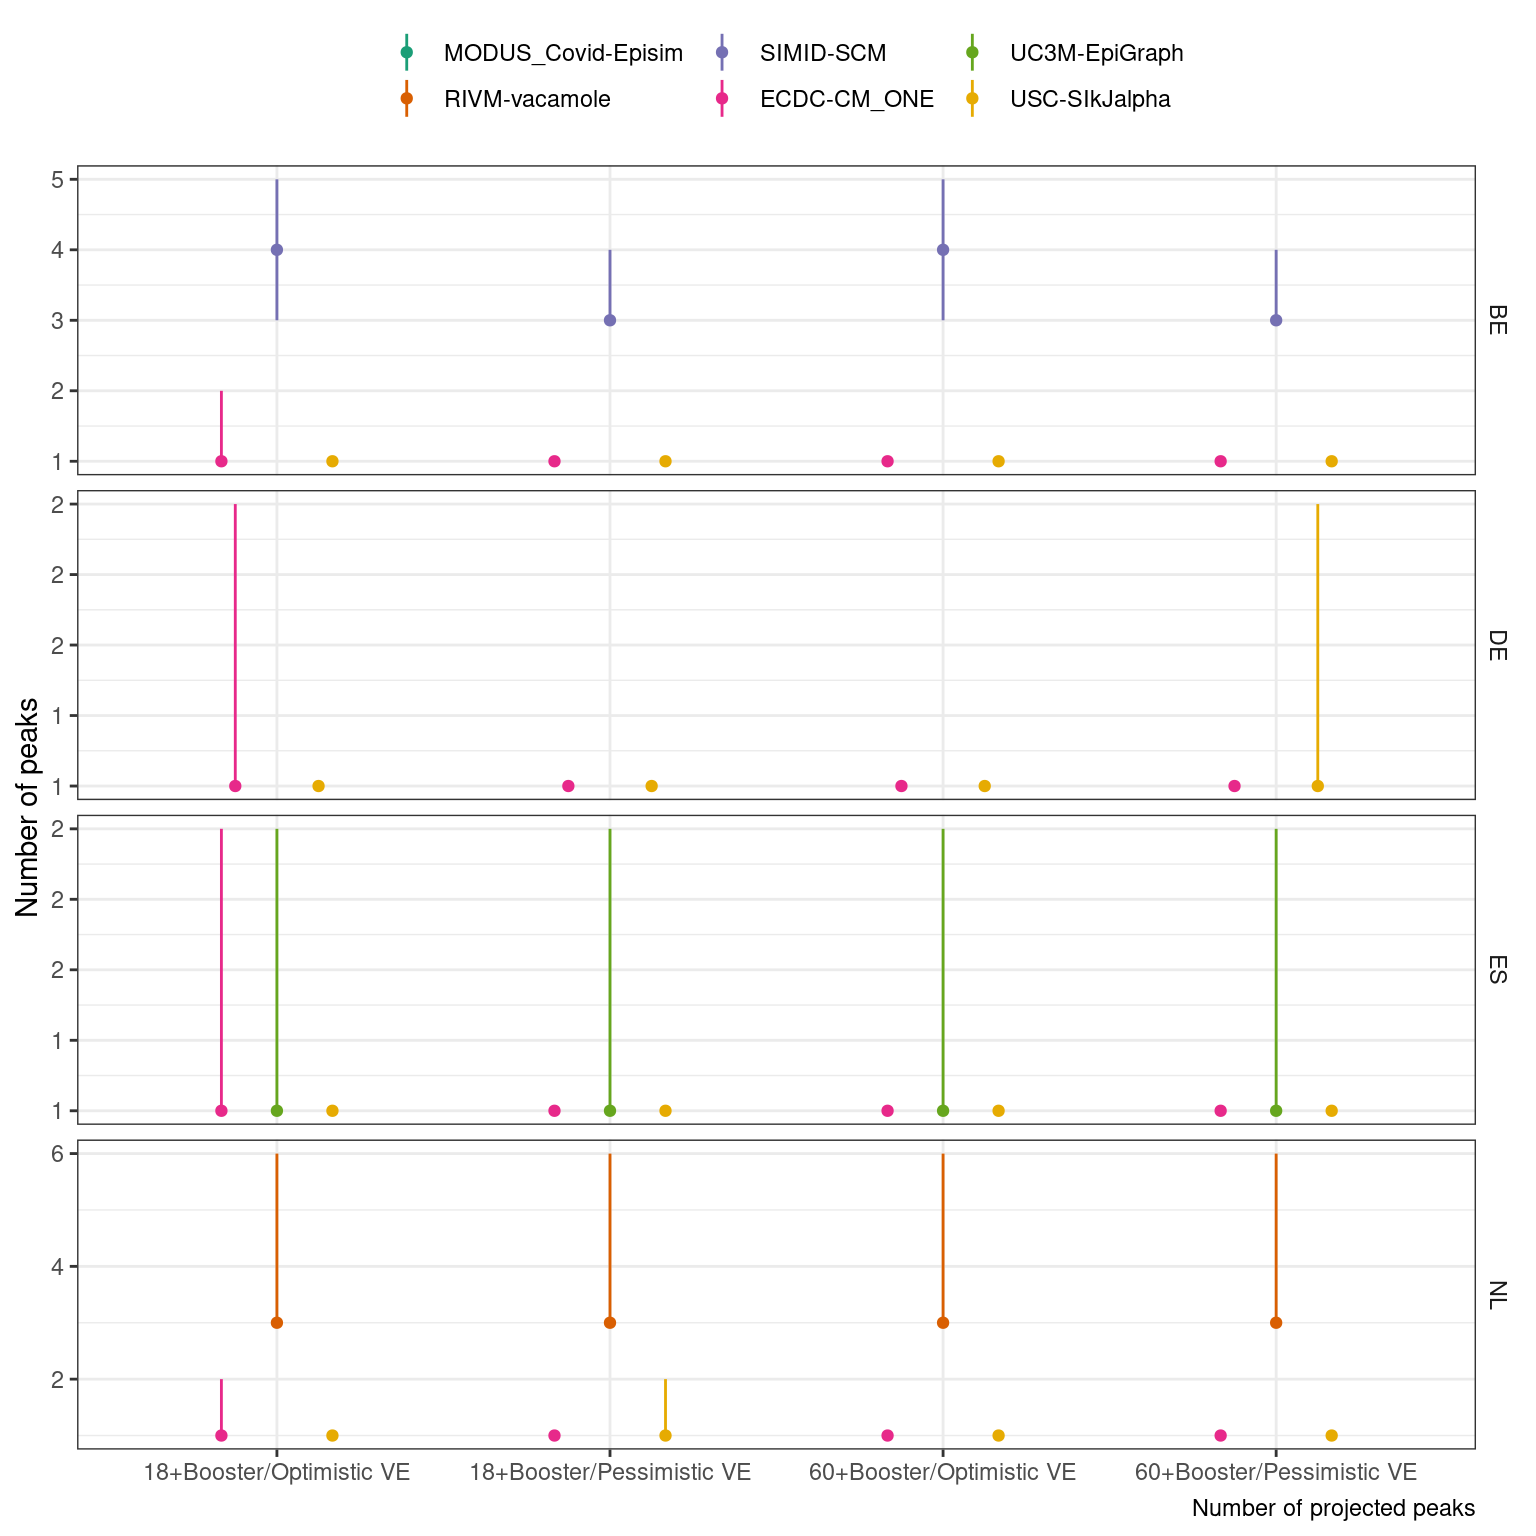
Infection
A. Size and timing of peaks. Boxplots show summary of the likely value at peak incidence (median and interquartile range); points show timing and size of peaks from independent sample simulations
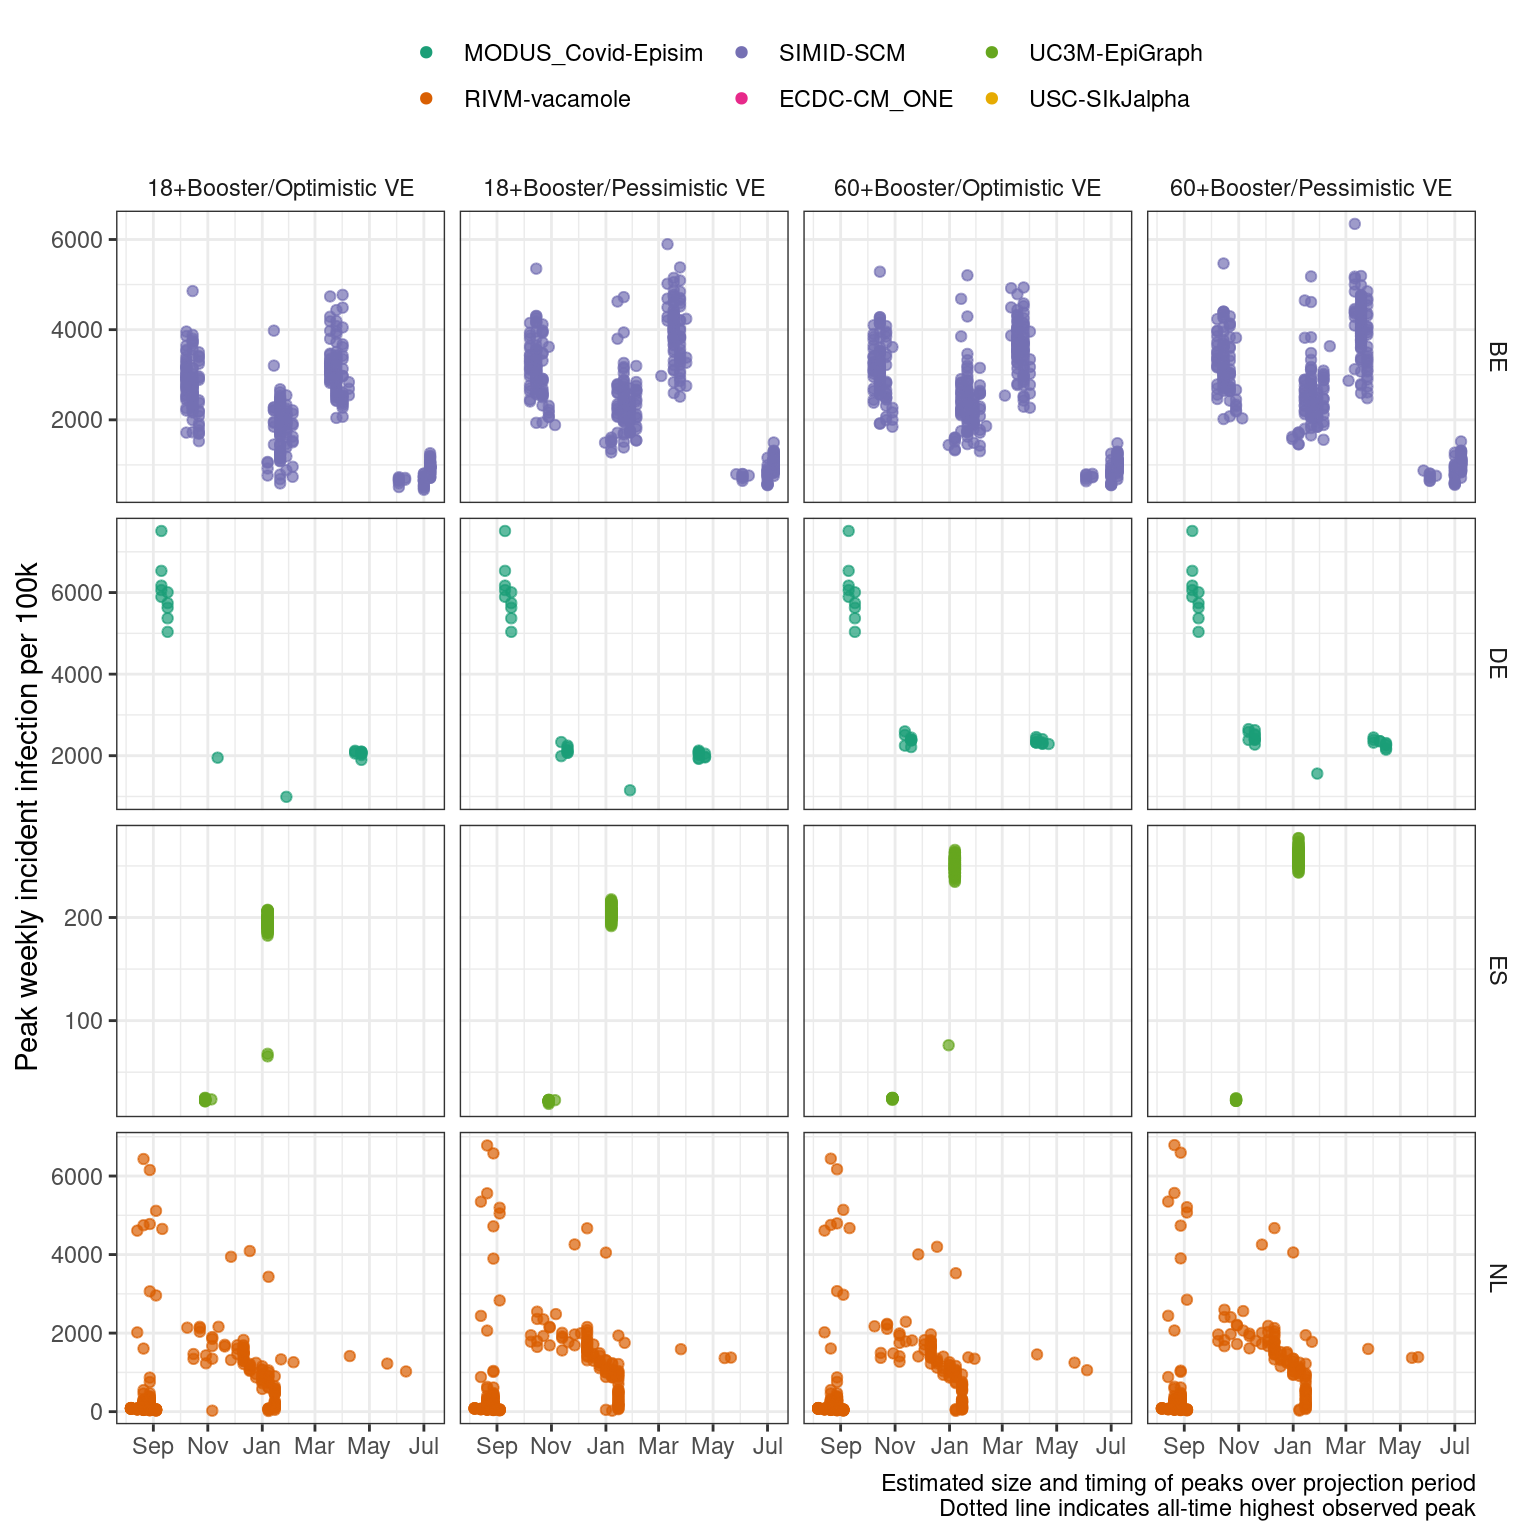
B. Projected number of peaks (median with 5-95% probability)
Scenarios: Autumn second booster campaign among population aged ‘18+’ or ‘60+’; Vaccine effectiveness is ‘optimistic’(effectiveness as of a booster vaccine against Delta) or ‘pessimistic’ (as against BA.4/BA.5/BA.2.75)
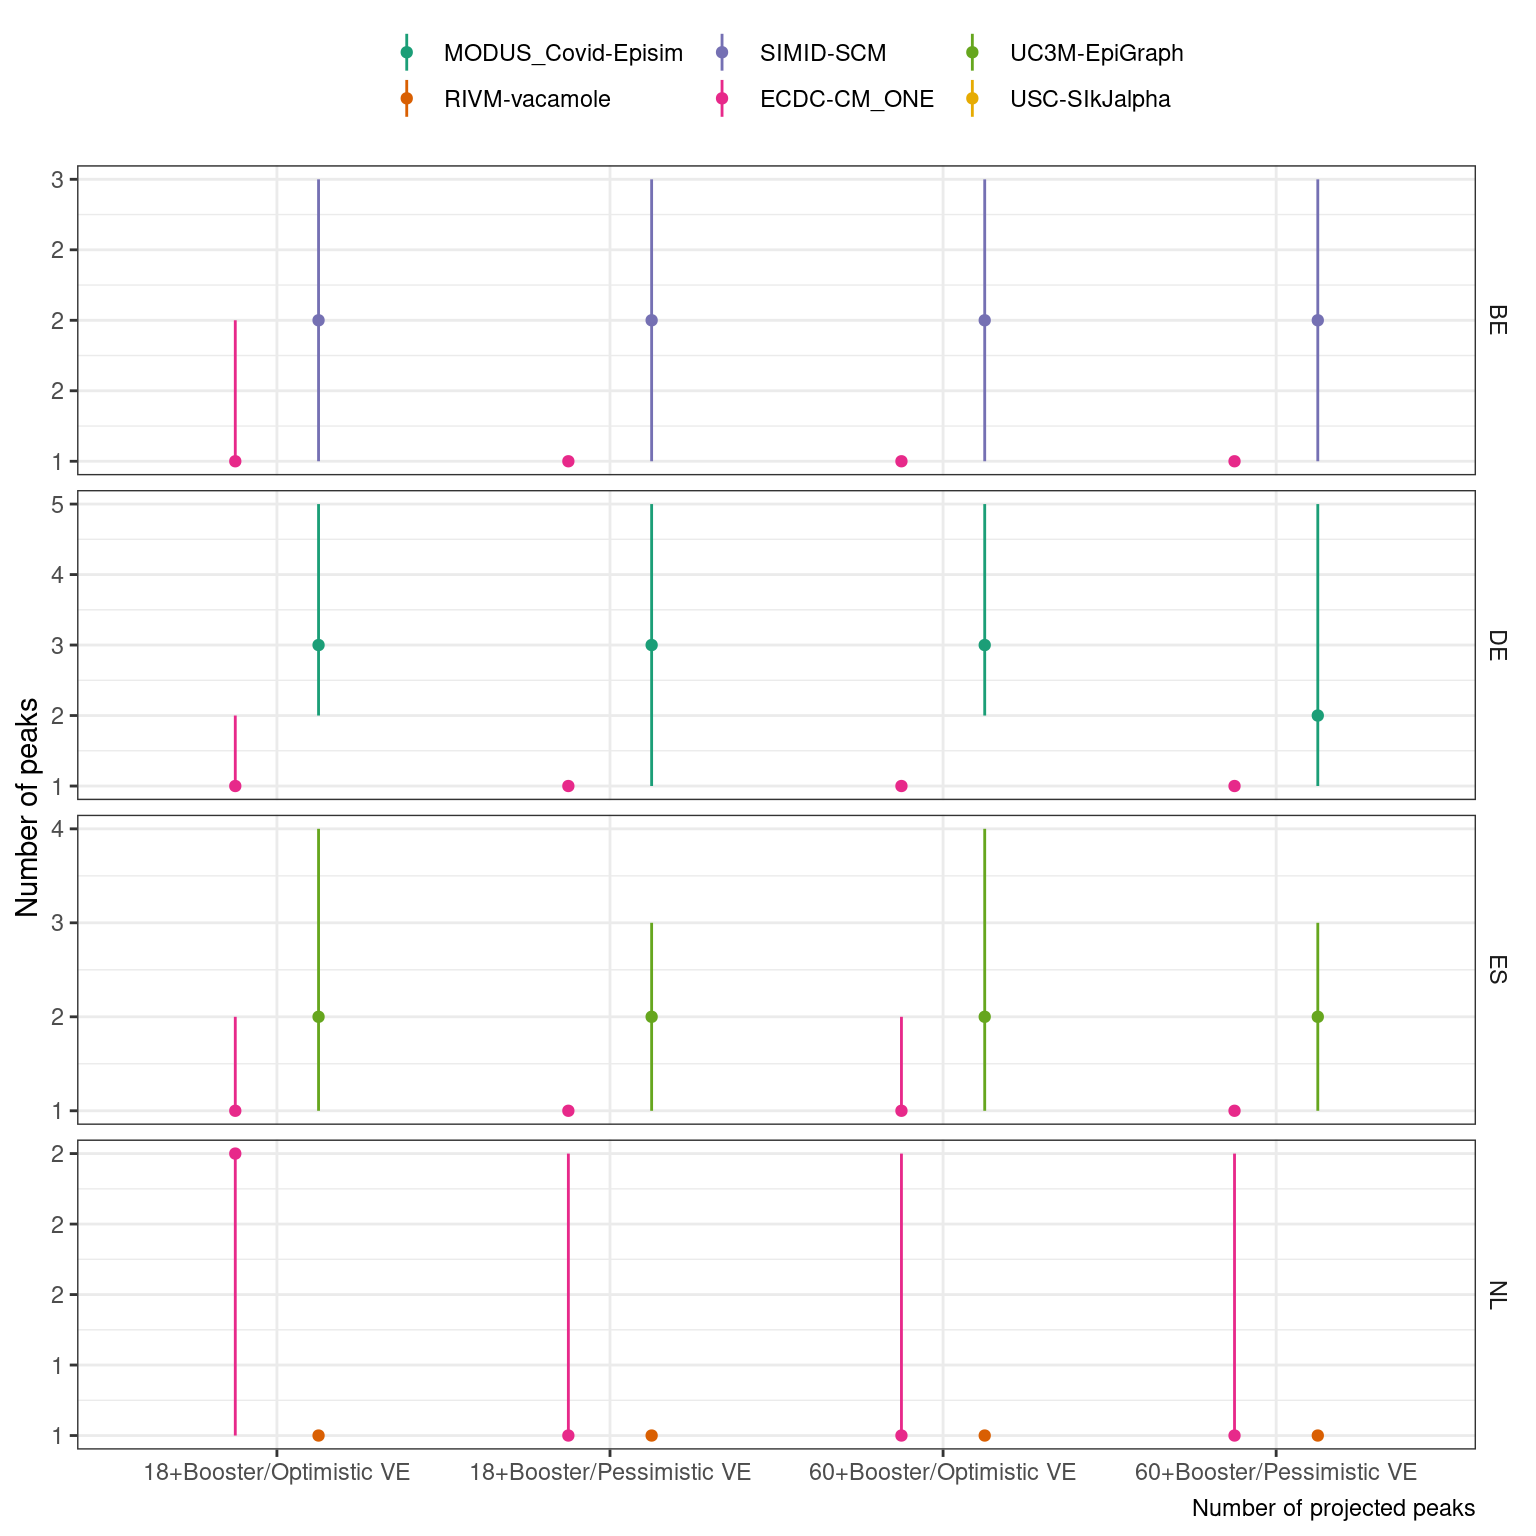
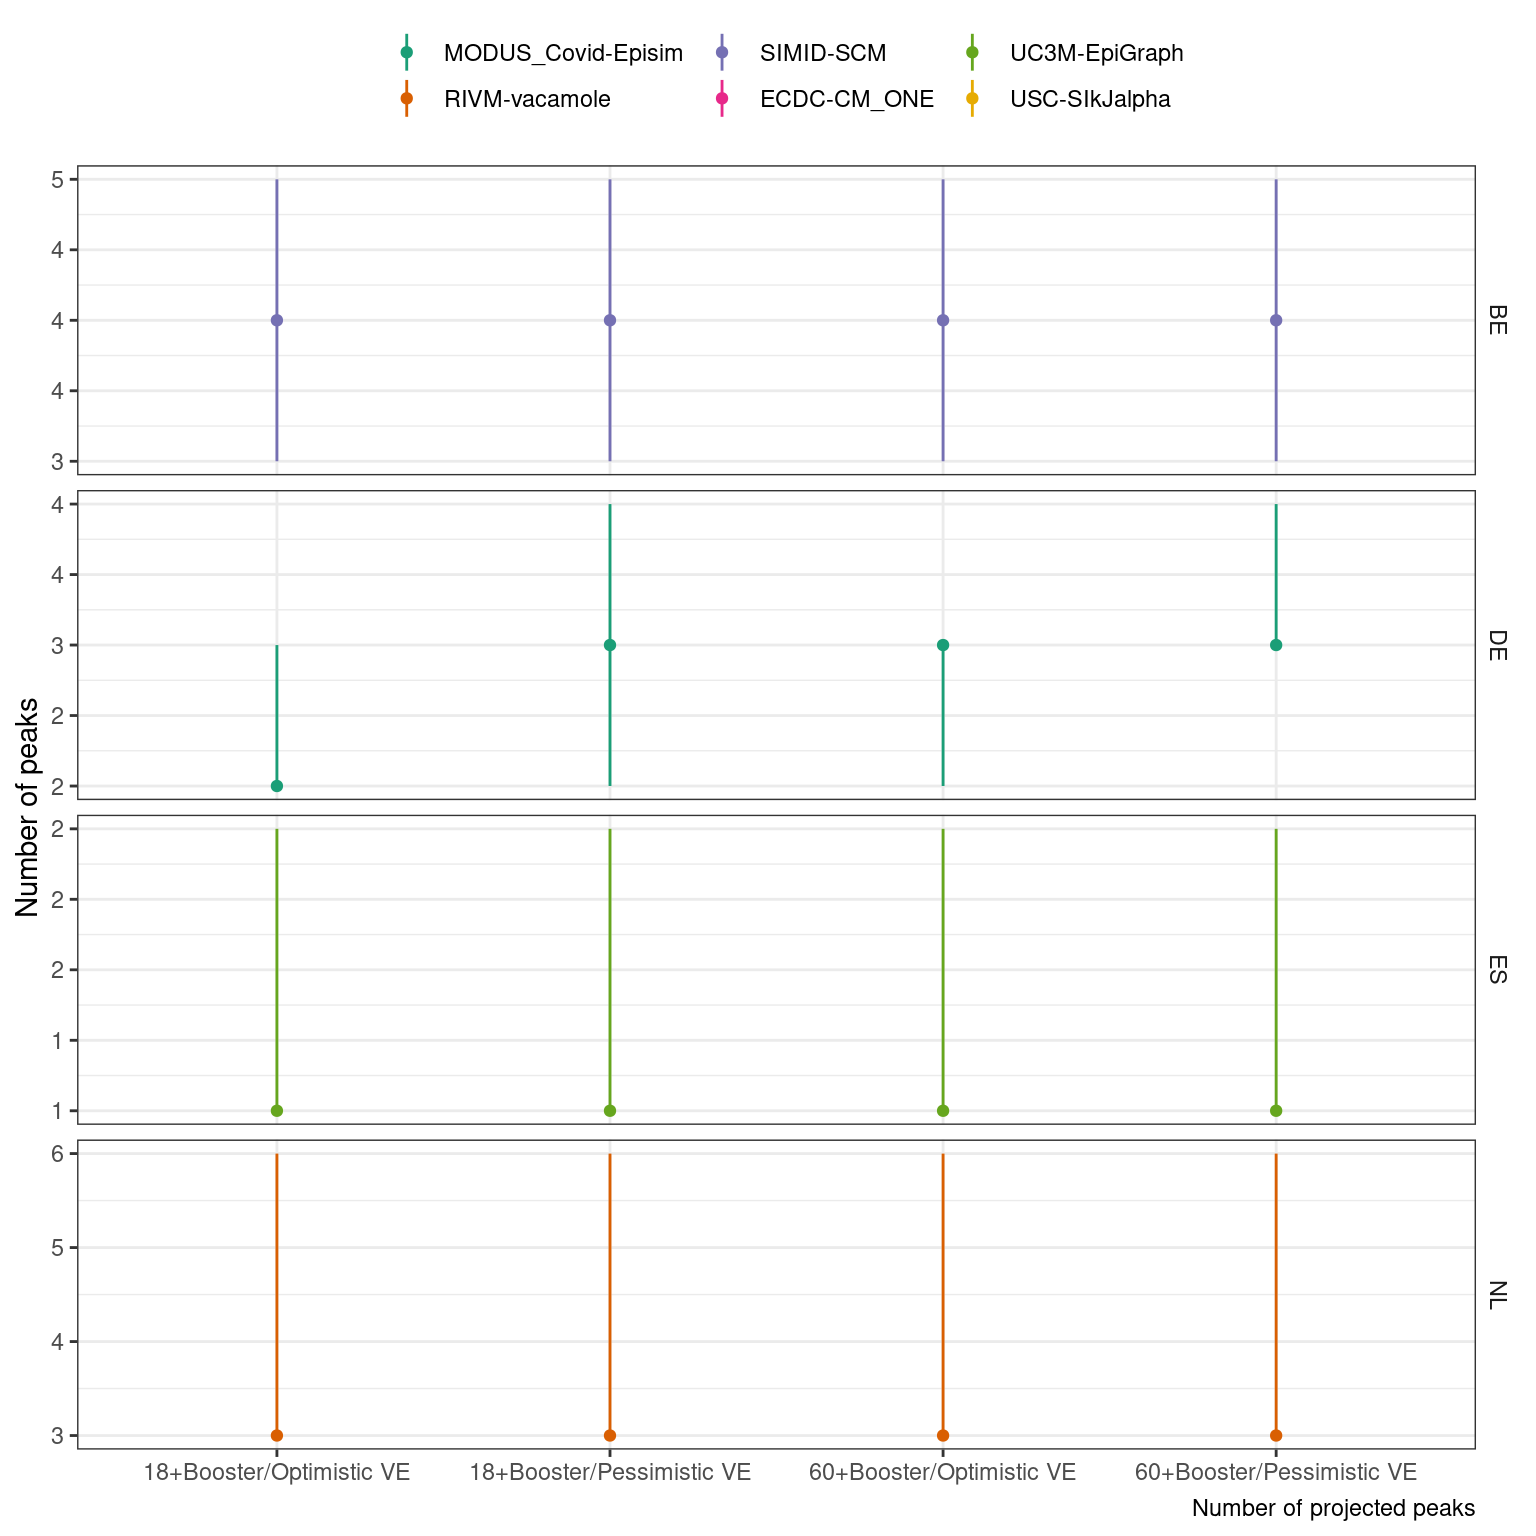
Hosp
A. Size and timing of peaks. Boxplots show summary of the likely value at peak incidence (median and interquartile range); points show timing and size of peaks from independent sample simulations
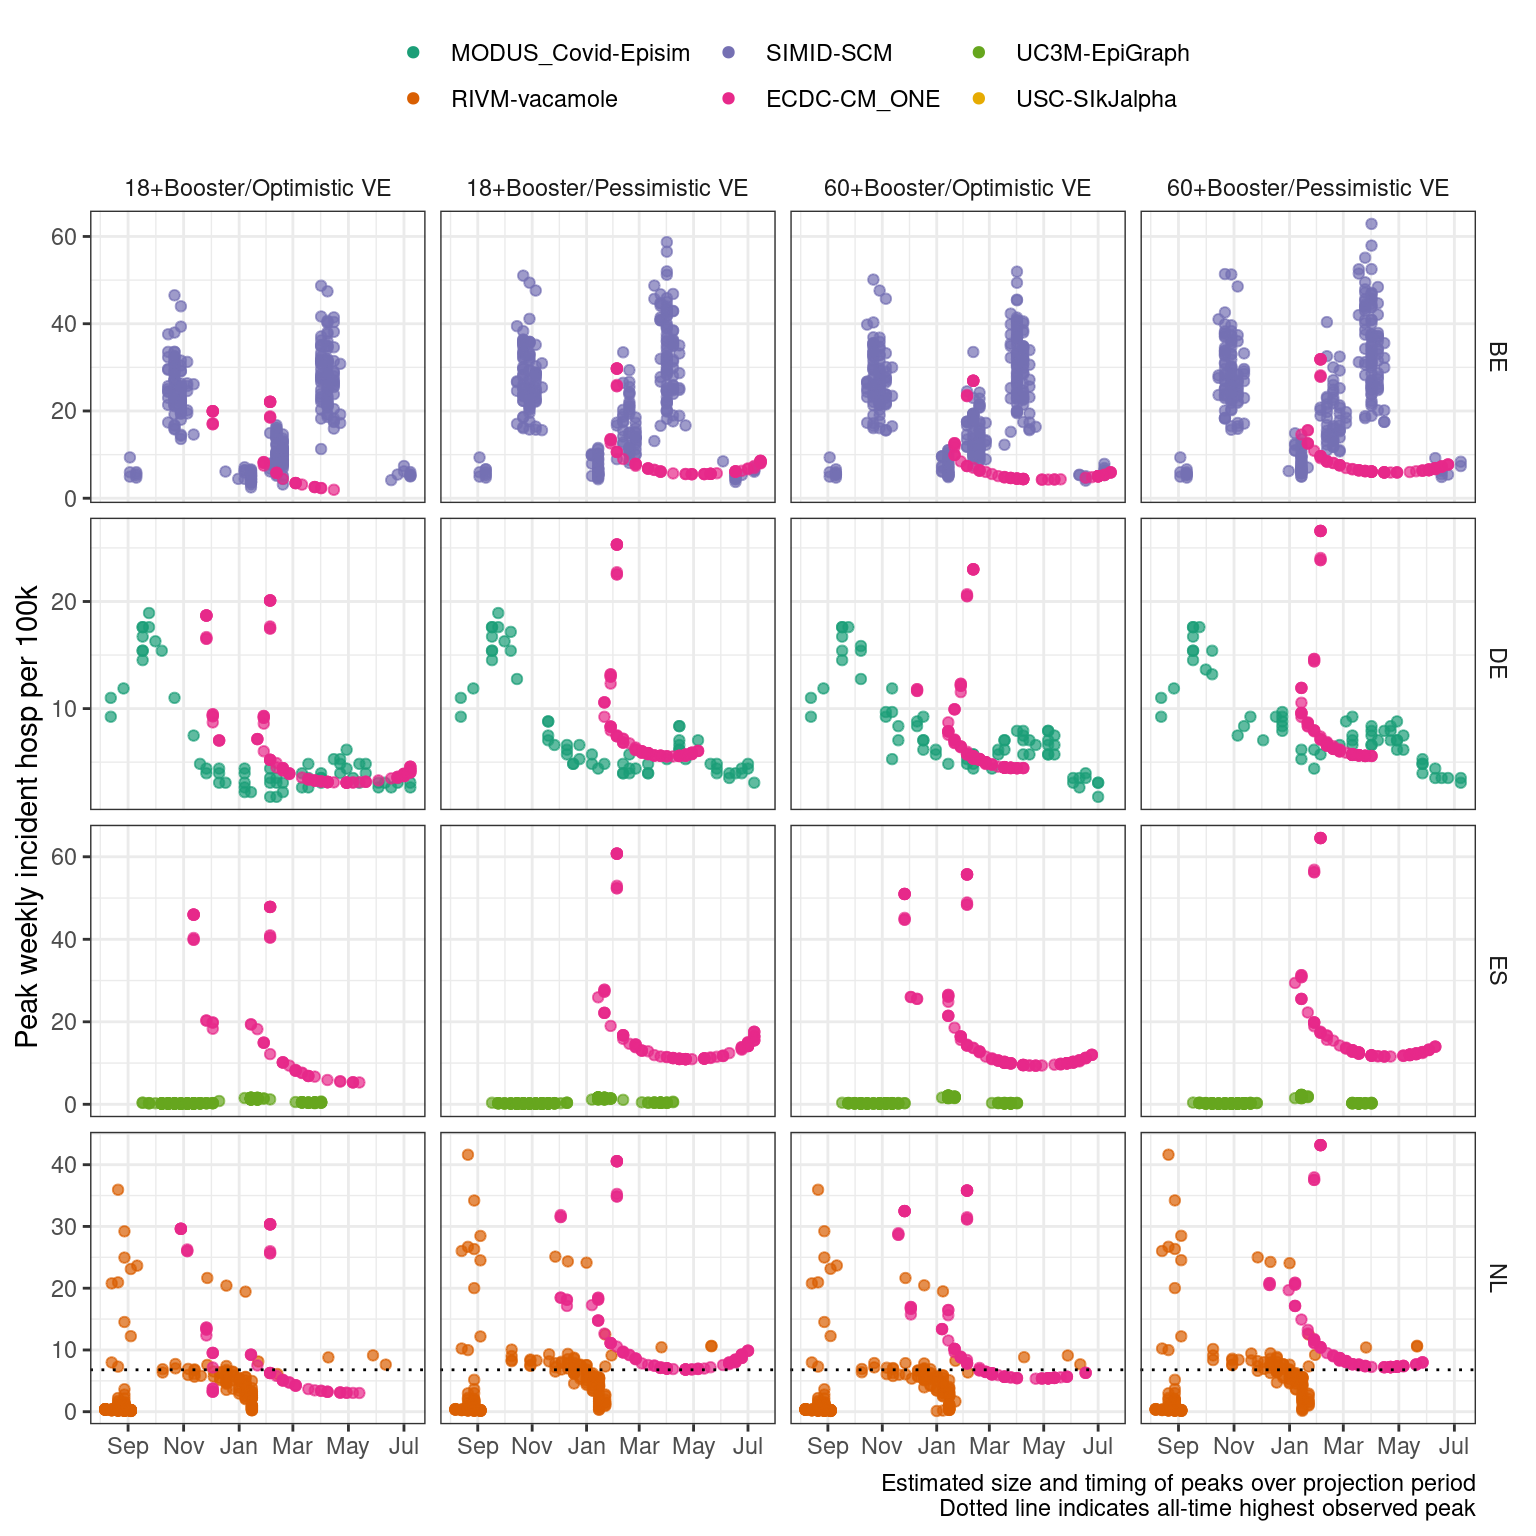
B. Projected number of peaks (median with 5-95% probability)
Scenarios: Autumn second booster campaign among population aged ‘18+’ or ‘60+’; Vaccine effectiveness is ‘optimistic’(effectiveness as of a booster vaccine against Delta) or ‘pessimistic’ (as against BA.4/BA.5/BA.2.75)
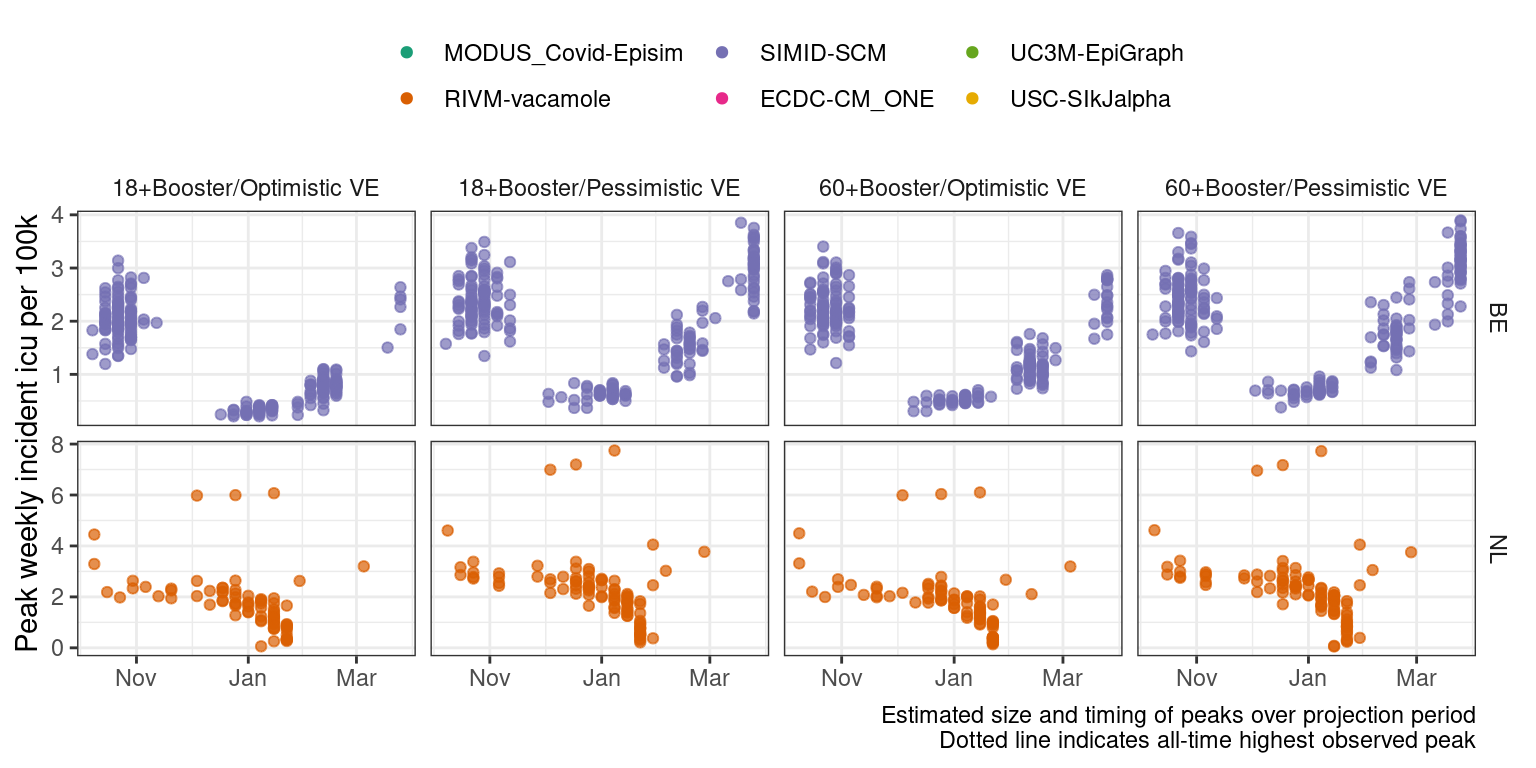
Icu
A. Size and timing of peaks. Boxplots show summary of the likely value at peak incidence (median and interquartile range); points show timing and size of peaks from independent sample simulations
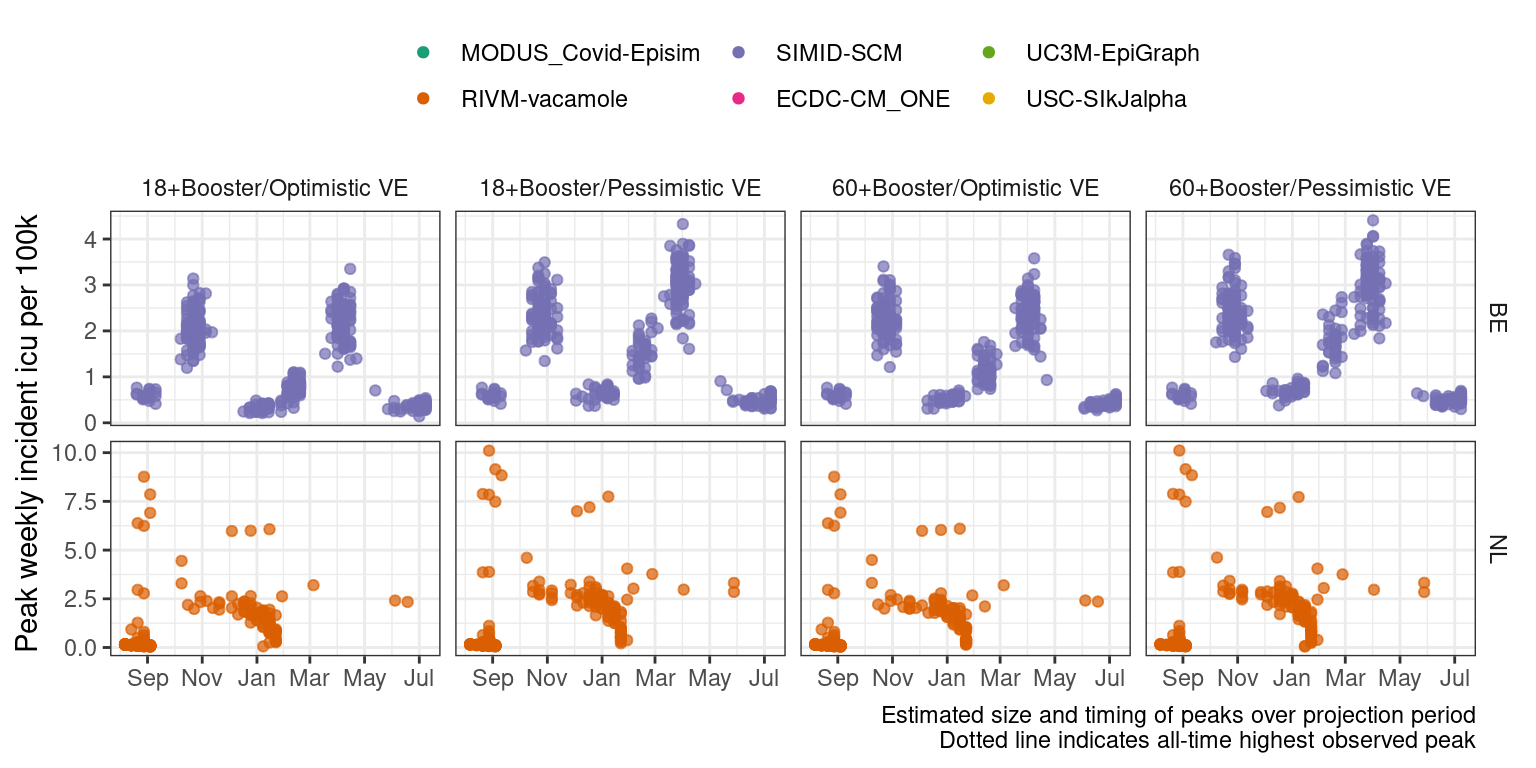
B. Projected number of peaks (median with 5-95% probability)
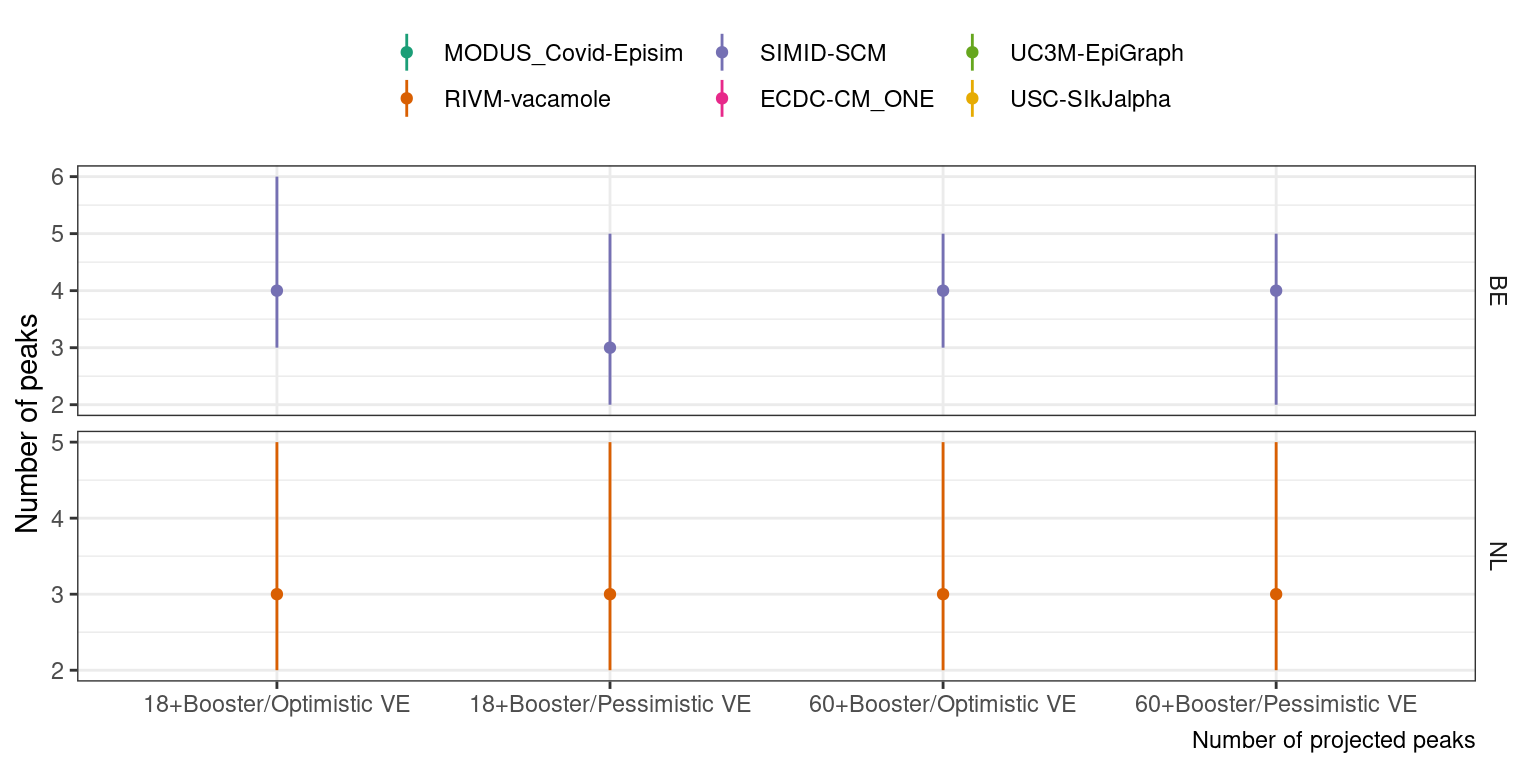
Scenarios: Autumn second booster campaign among population aged ‘18+’ or ‘60+’; Vaccine effectiveness is ‘optimistic’(effectiveness as of a booster vaccine against Delta) or ‘pessimistic’ (as against BA.4/BA.5/BA.2.75)