Round 3
Report created 2024-11-25
Scenarios
No further vaccination
|
Annual vaccination
|
Bi-annual vaccination
|
|
Optimistic variant scenario
|
Scenario A | Scenario B | Scenario C |
Pessimistic variant scenario
|
Scenario D | Scenario E | Scenario F |
* Vaccination as planned = Primary schedule + 2 booster doses
** Seasonal vaccination campaigns: Autumn = 15 September to 15 December; Spring = 15 March to 15 June
See also the full scenario details for more detail on the common set of assumptions teams used to create their models.
In Round 3, we asked modellers to start their projections from the 2022-09-11. Data after this date were not included, and as a result, model projections are unlikely to fully account for later information on the changing variants or behavioural patterns.
Round 3 submissions
Round 3 has received submissions from six international modelling teams across EU/EEA and beyond: Two teams submitted for 29 EU/EEA countries (not LI due to small numbers in the input data), one team submitted for twelve EU/EEA countries, and three teams submitted for one EU/EEA country. These submissions include five model submissions for infections and deaths, one model submission for cases, and five model submissions for hospitalisation projections.
Table 1. Participating teams by number of countries, scenarios, samples and time horizon
| Team | Countries | Scenario | Samples | Weeks | By age |
|---|---|---|---|---|---|
| USC-SIkJalpha | 29 | 6 | 96 | 156 | No |
| ECDC-CM_ONE | 29 | 6 | 20 | 259 | Yes |
| SwissTPH-OpenCOVID | 12 | 6 | 100 | 260 | Yes |
| SIMID-SCM | 1 | 6 | 100 | 522 | Yes |
| UC3M-EpiGraph | 1 | 6 | 6 | 524 | Yes |
| MOCOS | 1 | 3 | 100 | 121 | No |
Table 2. Number of independent model projections/samples for each target variable
| Team | Infections | Cases | Hospitalistions | Deaths |
|---|---|---|---|---|
| USC-SIkJalpha | 0 | 96 | 0 | 96 |
| ECDC-CM_ONE | 20 | 0 | 20 | 20 |
| SwissTPH-OpenCOVID | 100 | 0 | 100 | 100 |
| SIMID-SCM | 100 | 0 | 100 | 100 |
| UC3M-EpiGraph | 6 | 0 | 6 | 0 |
| MOCOS | 100 | 0 | 100 | 100 |
In this report we only show results from models that provided projections for all 6 scenarios (A-F), and for the three common outcomes of infections, hospitalisations and deaths.
Results
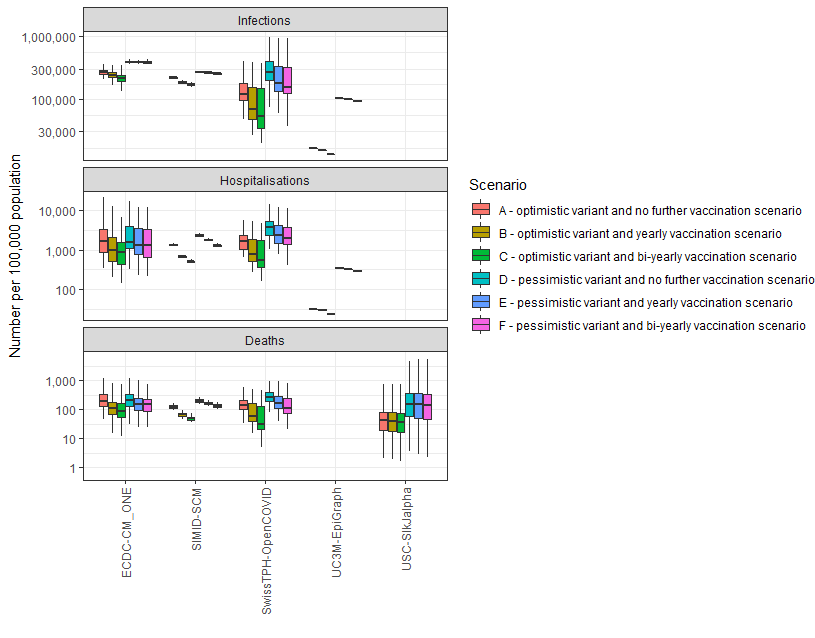
Cumulative outcomes in the next three years per 100,000 population
For each model and scenario, we compare the cumulative number of the three outcomes (infections, hospitalisations, and deaths) for the next three years. The results for each model are aggregated across samples from the random distributions that describe uncertain parameters as well as across all countries. Hence, the result for a single country could be closer to either the upper or the lower side of the boxplots that were obtain from all countries.
Figure 1 below shows that, for any given scenario, all three outcomes across different models are relatively consistent, including hospitalisation and death projections, which often include the highest level of variation across different models due to different assumptions (including the protection of vaccinations and prior infection, the speed of the waning of protection, etc). The ranking of scenarios A-C over D-F is also highlighting the differences in outcomes expected for the optimistic vs pessimistic variant, and the results show how the vaccination programmes reduce the burden compared to a scenario with no further vaccination.
Number of infections in the next three years over different age groups
We evaluated the average cumulative number of infections per individual person in three different age groups (aged <18 years, 18-59 years, and 60+ years) over the next three years for the different models and scenarios.
Figure 2 below shows that the largest risk of (re-)infection lies in the population younger than 60 years old, with multiple infections expected over the three-year period in most models and scenarios. The boxplots show the variation across different countries and samples from the random distributions that describe uncertain parameters. This risk is decreased with vaccination campaigns. Moreover, scenarios with the pessimistic variant introduction (D-F) generally lead to higher numbers of (re-)infections than the optimistic variant scenarios (A-C). Due to the aggregation over all submitted countries, the results of a single countries could be closer to either the upper or the lower side of the boxplots that were obtained from all countries.
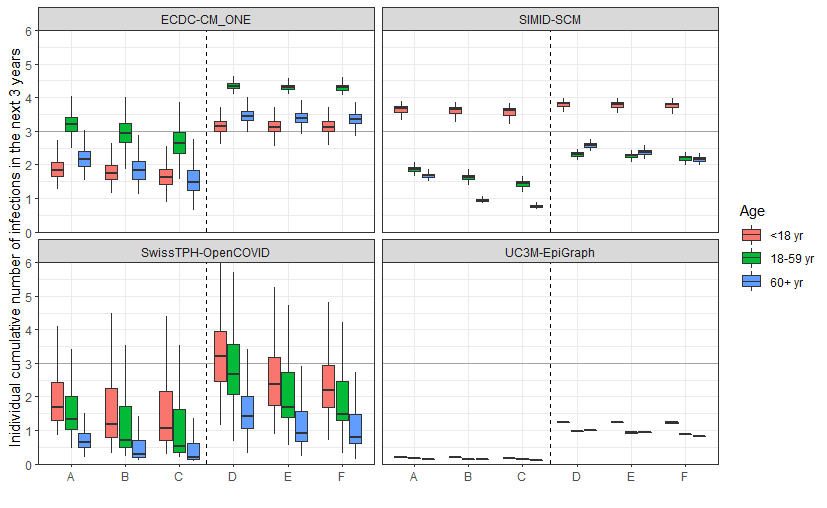
Scenarios: A - optimistic variant and no further vaccination scenario, B - optimistic variant and yearly vaccination scenario, C - optimistic variant and bi-yearly vaccination scenario, D - pessimistic variant and no further vaccination scenario, E - pessimistic variant and yearly vaccination scenario, F - pessimistic variant and bi-yearly vaccination scenario.
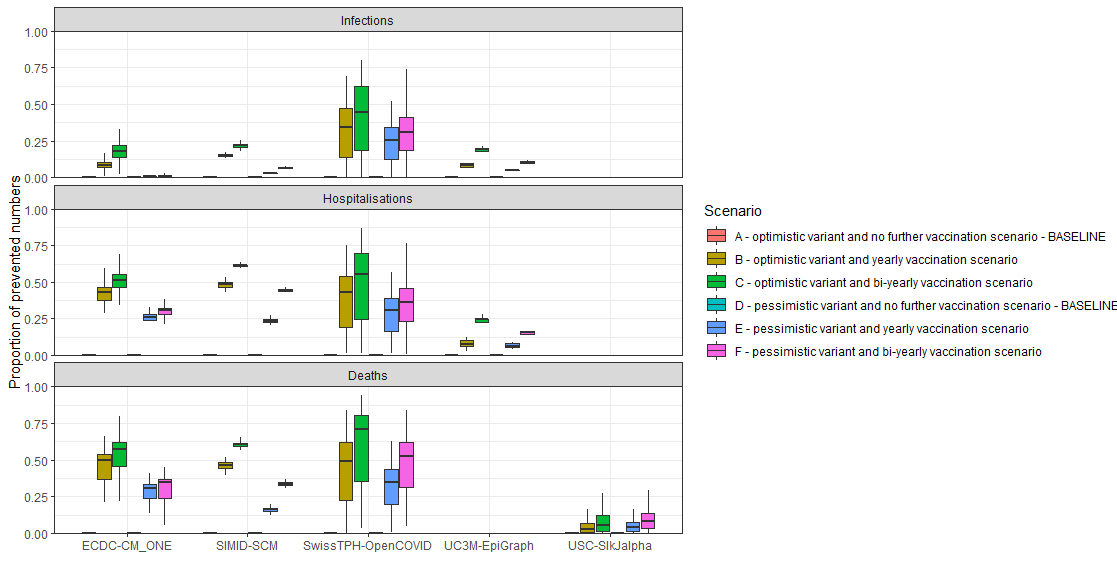
Relative impact of vaccination campaigns over the next three years
For each outcome, model and scenario, we evaluate the proportion of averted outcomes due to the vaccination campaigns (scenarios B-C and E-F). The cumulative outcome is compared between baseline scenario A (or D) and the corresponding vaccination campaign scenarios B and C (or E and F). The results are aggregated across different countries. Figure 3 below shows that the largest impact of vaccination programmes is seen for severe outcomes (hospitalisations and deaths), with the scenarios of the bi-yearly vaccination programmes (C and F) achieving the largest reduction in outcomes. Out of all three outcomes, the predicted number of infections varies the most across models and scenarios (see also Figure 1), which is also due to summarising the outcomes of models for different countries, and this translates also in the averted number of infections here. Results are more aligning for the severe outcomes of hospitalisations and deaths (both in Figure 1 and Figure 3 below).